Thursday, April 29, 2010

The impact of the DP on MLS Playoffs


Get your team a DP if you want the best chance at this hardware.

In previous posts I have shown how the designated player (DP) in MLS is driving up league payrolls, and how team payroll has zero correlation to how you finish in the MLS regular season table. As I mentioned in the payroll/table post, there are many reasons for the lack of correlation. One of the more prominent ones is the roll of the playoffs, with the logical question being:
  • If team payroll is being pushed by teams with DP's, do teams with DP's at least have a better chance at winning the MLS cup?
The Data

To determine if there is an effect from the DP, I must answer the two following questions:
  1. Is there a statistically significant greater proportion of teams with a DP that qualify for the MLS Cup playoffs?
  2. Once in the playoffs, do teams with a DP win more of the first round series?
Admittedly, the statistics that will be calculated here will be a bit limited as the DP has only been in place for three MLS seasons. This means there will be three proportions for two data sets for each of the two questions.

To create the data to answer the questions, I must create proportions based upon teams with and without DP's. Figure 1 shows such proportions for each season. Note that the denominators in each proportion change as teams were added to the league each of the years, and the number of teams taking advantage of the DP rule has increased over time. The two data sets test as normal, so two sample t-tests can be used to evaluate the statistics.

Figure 1: Proportion of teams in playoffs by team type

For the purposes of this analysis, teams with DP's were identified based upon those listed in the Wikipedia article on the topic. Compiled data can be found here.

Getting into the playoffs

When a two sample t-test is performed on this data, it becomes clear that teams with a DP have a distinct advantage in qualifying for the MLS Cup playoffs. See Figure 2 for the results of the test.

Figure 2: Results of two sample t-test of teams with and without DP

The p-value of 0.008 indicates that their is a low risk of incorrectly concluding that teams with DP's qualify in a statistically significantly greater proportion for the playoffs than teams without DP's. In fact, the estimated gap is 41%, with the lower 95% confidence of that gap being nearly 21%. The DP may not be causing this directly - perhaps having a DP is a sign of a club that has a higher overall commitment to quality soccer than those who don't. Nevertheless, having or not having a DP on a team is a good indicator of a club's chances for the postseason.

It should then come as no surprise then that the first team to qualify for the playoffs in their inaugural season in nearly a decade - Seattle Sounders FC - had a designated player on their team in 2009.

Making the conference finals

The statistics are even bleaker for non-DP teams once the playoffs start. From 2007-2009, 83% of the teams who have made it through to the second round of the playoffs have had a DP on them. The only team to win a first round series without a DP was Real Salt Lake in 2008 and 2009, with their run in 2009 leading to an MLS Cup trophy by upsetting the team with the ultimate DP - the LA Galaxy and David Beckham. Until that point, MLS Cups had been contested between two teams that each had a DP.

Conclusions

While spending on the DP and other players varies wildly from club to club, the impact of the DP cannot be underestimated. Whether it is an outsized impact on the pitch, or that they represent an increased level of commitment to the entire team by the ownership, having a DP on one's team goes a long way to predicting postseason qualification and performance. The Philadelphia Union do not have a DP, and thus will likely not repeat Seattle's performance in qualifying for the postseason in their expansion year. The Vancouver Whitecaps and Portland Timbers should heed the numbers, and look to spend a modest amount of money on a DP in their first season in MLS in 2011.

It will also be interesting to watch how the addition of a second and third DP to teams will impact the results of playoff qualification and first round outcomes. This will surely be a topic I revisit at the conclusion of each season.

Tuesday, April 27, 2010

Why Arsenal are poised to spend big, and Liverpool's sale is tough


A money losing proposition, year in and year out

Forbes recently published their latest data on soccer club values and their financial inflows and outflows. Comparing this data to previous reports provides some insight into how the major clubs in Europe have managed their finances in the hyper-competitive economics of soccer while concurrently weathering a world wide recession. It also provides insight into whether or not the asking price for Liverpool is reasonable.

Background on 2010 Data

The Forbes data is expressed in dollars, which means it is subject to exchange rate fluctuation from year to year.
From June 2008 to June 2009 the euro and pound fell 11% and 17%, respectively, relative to the dollar. As result, the top 20 clubs have an average enterprise value (equity plus net debt) of $632 million vs. $691 million a year ago. The 8.5% decline equates to a $1.2 billion aggregate loss in value. Absent the conversion to U.S. dollars the clubs appreciated in value--2.7% in euros and 10.7% in pounds. Our team values are calculated using revenue (excluding player transfers and dispositions) multiples based on historical transactions.
My analysis will attempt to eliminate this exchange rate change by examining two critical business ratios: revenues-to-debts and income-to-revenues (or profit margin). Far be it from me to suggest Forbes' is wrong, but these two commonly used business metrics that are not included in their analysis can help us understand how heavy a club's debt load is and what their return on revenue is. Using the ratios helps to eliminate the need to apply an inflation rate to the previous years' data, as the ratios are calculated within each single year's data set. Ratios do present a problem though - a number of teams reported zero debt in the Forbes studies, which generates a divide by zero error. In that case, I have assigned the highest calculated revenue-to-debt ratio to any club with zero debt. For the purposes of this analysis it doesn't really skew the data.

Forbes has data going all the way back to 2004. I have purposefully chosen to focus on data from 2006 onwards (my compilation of data is available here). This ensures that the vast majority of the teams on the 2010 list are represented throughout the years studied, minimizing the effect of teams showing up and/or leaving the lists and distorting the longer term trends I am interested in. The other interesting attribute of the data is that every year except 2010 has the Top-25 teams listed. In 2010, Forbes only lists the Top-20 teams in 2010.

Analysis of all teams

To begin with, I analyzed the statistics associated with the countries represented in the Forbes list for the 2006 through 2010 seasons. The Forbes lists during that time had teams from eight countries, but has consolidated to teams from five countries in 2010 by only focusing on the Top-20 teams. Click on Figure 1 to see a breakdown of the number of teams by year and country.

Figure 1: Number of teams in Forbes' list by year and country (click to enlarge)

England was the most penalized with the decision to only publish the Top 20 in 2010 - they lost two of the nine squads listed in 2009. Scotland's lone two remaining clubs also fell off the list, while Germany lost one team. France, Italy, and Spain maintained their level of clubs from 2009. England is the best represented nation, supplying an average of 9 participants in the list each of the five years. France and Spain each only supplied an average of two per year, while Germany and Italy were stable at 5 and 4, respectively. This provides a good overall commentary on both the strength and diversity of the English leagues, where as the results also confirms some of the worst fears about the French and Spanish leagues being two horse shows.

The impact of this diversity (or concentration) of entrants in the Forbes lists also has an impact on the average finish of the teams from each country. To simplify the analysis I have narrowed it down to the five countries represented in all five years of the survey - England, France, Germany, Italy, and Spain. Figure 2 shows the average finishing position of the teams from each country. England's 7-10 teams each year finish right around the list average of 12.5, while France's teams finish in the lower third. Spain and Italy's teams consistently overachieve, with Barcelona's recent surge in the rankings raising Spain's two team average finish to 3.o in 2010.

Figure 2: Average finish position by country and year.

Now to move on to the financials of each country's clubs. The first evaluation is made of the revenue-to-debt. This measures how easily a team can service the debts that they have - the higher the ratio, the more flexibility they club has. In this regard, the English sides are at a disadvantage compared to their continental competition. Figure 3 shows the relationships of the revenue-to-debt ratios.

Figure 3: Revenue-to-debt ratio by country and year

In this measure, the English teams are averaging half the ratio of the total average (3.69 to 6.84). Spain's two teams, who have crept into the Top 4 teams in terms of value by 2010, are outstripping the English teams. Truly impressive is Germany, whose teams have nearly the same average finishing position yet do it with nearly three times the ratio of revenue to debts - confirming some perceptions about the financial benefits of the Bundesliga. Italy, with its relatively debt free four teams, finishes in the Top-2 in four out of the five years and first overall. Their emergence on the international scene and potential revenue sources will be enhanced with their top league's recent TV deal.

Finally, a check of the country's average net profit margin continues the bad news for the English sides. See Figure 4. A league average profit margin of 7% is misleading, given that it was -1% in 2010. Spain and Italy lead the pack, with Spain's 11% average buoyed by an average 23% profitability in 2010, the highest single year average! The four Italian squads seem to have the most consistent profitability of the five major countries.

Figure 4: Average profit margin by country and year.

Overall, the English leagues are still tops in value, but the Italian league may be the most impressive with its high number of teams (4) that consistently finish near the top of all the metrics.

Analysis of the English Teams

Being a Gooner, the English teams are of special interest to me. In my analysis I am focusing on the top four English teams in the survey, which happen to be the Big 4 in the Premier League.

Figure 5 shows the revenue-to-debt ratios for the Big 4. Manchester United has the lowest revenue to debt ratio, which is really just a relic of the debt taken on during the Glazer takeover of the club. Chelsea's ratio seems to be in a good bit of flux, with much of the rebound in 2010 due to the owner's forgiveness of the debt in return for equity. Arsenal's debt load spiked due to the building of Emirates Stadium, but has been steadily receding. The net effect is Arsene Wenger is ready to splash some cash in this summer's transfer market.

Figure 5: Revenue-to-debt ratio of Big 4

Especially troubling is Liverpool's debt position. It has steadily eroded under the ownership of Hicks and Gillette. Unlike Arsenal, the debt hasn't been used to guarantee future revenue streams through a stadium expansion. It has been used to buy players, the end result is this year's finish outside the Top 4 in the Premier League. Investors looking at such a debt ratio - in line with Manchester or Arsenal - would be disappointed to not find the international marketing presence or stadium size associated with those two soccer clubs.

The status of the Big 4, especially for Liverpool, gets more interesting when profit margins are examined. See Figure 6. Chelsea's M.O. is clear - win by losing any amount of money that is required. More troubling is that Liverpool has the next lowest average profitability, and has shown a steady decline the last three years after Gillette and Hicks bought the team. Manchester's worldwide brand is clearly paying dividends, while Arsenal finishes a strong second and closes the gap by the end of the decade. The business case for a Liverpool purchase looks a bit difficult if it's competition is Arsenal, Chelsea, and Manchester.

Figure 6: Profit Margins of Big 4

Finally, we examine the average finishing position in the Forbes survey of the Big 4. See Figure 7. Manchester United, Arsenal, and Chelsea have been stable from 2006-2010. Liverpool, however, has moved through more than a quarter of the survey's positions. Liverpool's value greatly benefited from the sale price to Gillette and Hicks in 2007, which was reflected in 2008's survey results. But much like a home sale that hasn't kept up with the neighborhood, Liverpool has not been able to keep up with the rest of the field the last two years and has slid several positions. That's a third strike against a high priced sale when comparing Liverpool to the rest of the Big 4.

Figure 7: Average finish position of the Big 4

Conclusions

Manchester's future seems stable, although the staggering debt load is obviously of concern to the ownership and supporters. Chelsea's owner seems committed to spending whatever it takes to win - a blessing for the team and its supporters, but a potential disaster for the league. The best thing Chelsea's leadership could do for the club is find a way to deliver the long delayed expansion at Stamford Bridge, and continue to expand its international supporter ranks.

Liverpool's and Arsenal's situations couldn't be more different. Liverpool needs new ownership and a new organizational direction. It needs to rebuild its balance sheet, and it desperately needs a new stadium to compete with the other Big 4 in revenue. Instead, it has a delusional ownership group who, despite all the evidence presented above, feels it is entitled to between £600m to £800m ($920M to $1,227M) for making the club's books and team worse than when they got them. This is the thought process of a man looking to cover his overall failure in managing his sports empire - a 12% to 49% premium over what Forbes says the club is really worth.

Arsenal, on the other hand, seems perfectly positioned for the future. Smart investment and deferred trophies over the last 5 years to finance the new stadium are enabling Arsene Wenger and the organization to have a consistent revenue stream to spend in the future. During a time where the transfer expenditures by Arsenal were austere compared to their Big 4 brethren, their finishes have been above average based upon what would be expected of their expenditures. Manchester has better brand recognition, but it may be interesting to watch how a shrewd Wenger and a financially liberated Arsenal competes financially and on the pitch against the likes of ManU and Chelsea.

Sunday, April 25, 2010

Perhaps some transfers are worth the money

Readers of Soccernomics know that one of the key conclusions made in the book is that transfer fees explain very little of a team's success via average table finishing position. Authors Simon Kuper and Stefan Szymanski conclude:
In fact, the amount that almost any club spends on transfer fees bears little relation to where it finishes in the league. We studied the spending of forty English clubs between 1978 and 1997, and found that their outlay on transfers explained only 16 percent of their total variation in league position.
The statistician in me wonders what the Pearson correlation coefficient was of that data so, just so I could understand if that variation is even statistically significant. But I digress...

Perhaps the authors of Soccernomics were looking at too wide of a data set when attempting to quantify the effects of transfers. Just like the stock market, transfers are a bet by one team that they can get a better value out of a player than the asking price of the team who currently owns the player's rights. And just like the stock market, a good number of people bet wrong and thus lose money. In soccer, a good number of managers may be betting wrong and thus leading to a poor correlation. Maybe we shouldn't look at all of the clubs, and instead look to the successful clubs. Let me explain.

I have been lucky enough to have Paul Tomkins pick up on my blog-related tweets, and a single re-tweet from this man can elicit ten times the re-tweets from his loyal followers. A week ago he recommended that I check out his Transfer Price Index (TPI) where he has been able to assemble all of the transfers during the Premier League era into a single database for comparison. I finally got a few hours today to work through the posts he has made so far, which I summarize below. In general, I would say it is a must read as it does a more detailed analysis of transfers than Soccernomics and comes to some different conclusions.

In one post, Tomkins analyzes the effect of gross expenditures of teams.

What’s most interesting is what happens to most clubs in the year or two after a particularly big Gross spend (+10% of the total Premier League outlay).

In total, this figure has been exceeded on 31 occasions over the past 18 years, with 12 different clubs managing to do so at least once, and with two (Manchester United and Chelsea) breaching it on no fewer than five occasions.

He then goes on to explain the trophies won by teams the season after such expenditures are made. Without doing a statistical analysis, the case for team improvement is compelling.

In another post, Tomkins then compares the net expenditure of teams, allowing sales that offset purchases to tell a more complete story.

If the fact that Chelsea accounted for 39% of the entire Premiership’s Gross spend in 2003 was incredible, that it rises to 67.9% of all of that season’s Net outlay is quite jaw-dropping. This is a club that was buying, buying and buying, with precious little selling involved. Whereas major clubs normally at least have to sell a star or two for profit to reinvest, this was a pure purchasing machine. A year later it was followed by a further 49.5% of the entire division’s Net outlay.

Looking at net spending helps us understand who's spending far more money than others, who's driving up league debt levels, and which squads are winning in the transfer game by consistently buying low and selling high. I will leave it to readers to click on the links and read Tomkins' awesome conclusions.

Tomkins' approach is superior to that of Soccernomics for one simple reason: transfers are one time fees that are speculative in nature and often used to either plug a short term hole or pay off immediately by shoving a good team to the top. Looking at them on the average, and only looking at the buyer's results, is a bit simplistic and likely to miss the short term payoff of the transfer. Tomkins' approach captures this effect. I am hoping that his partner, Graeme Riley, uses some of his advanced statistics skills to produce solid time-series statistical analysis from the TPI data set. It could be very powerful in revealing the effects of transfers in the Premier League.

Saturday, April 24, 2010

Payroll doesn't win MLS Supporters' Shields


You can't buy this kind of hardware.

I made posts here, here, and here recreating the Soccernomics' pay-to-win regression, as well as highlighting some hidden results that the authors of that book didn't publish. Previous to that series of posts I highlighted the fact that MLS team payroll disparity isn't increasing, the average MLS team payroll is increasing at three times the rate of inflation, and teams with designated players (DP's) are the ones fueling that rise. The next logical question that arises is:
  • Is there a correlation between MLS team payroll and finishing position like there is in the English leagues?
Background

For my international readers, I must take a few sentences to explain the Americanized version of the world's game that MLS plays. We don't award our championship to the team that wins the table. Instead, we give them what we call a Supporters' Shield which qualifies them for the CONCACAF Champions League, and then we break them and the next seven teams into a playoff. That's right - our domestic league uses a knockout round system to determine its champion. This bows to the very American way of determining championships in every other major sport - hockey, basketball, football, and baseball. In all of those other sports except football, playoff teams at least have to win a 5 or 7 game series to advance to the next round - that is, they have to win 3 or 4 games over their opponent. MLS and our football league - the NFL - have largely decided on a single game format. One match between two sides decides who advances to the next round of the playoffs. Pull off one above average performance, and you can easily send a team that consistently outperformed you all season into the off season wondering what all that hard work was for.

Not content to be like every other US sports league, MLS does throw in a home-and-away format in the first round of the playoffs. It's not clear to me why they do this in the first round but not the second round or the MLS Cup. Perhaps it is an attempt to prevent a large number of first round upsets, but it isn't exactly clear to me the purpose it serves.

To keep the playoffs interesting, MLS breaks eight teams every year into the playoff tournament. This presents some interesting challenges for a growing league. The total number of teams in MLS the past few seasons is as follows:
  • 2005: 12
  • 2006: 12
  • 2007: 13
  • 2008: 14
  • 2009: 15
  • 2010: 16
The teams added in 2007 through 2010 are not ones promoted from lower divisions - they are new franchises created for the explicit purpose of playing in MLS. This is another key difference from the rest of the world's game. Because of the rapid growth the last four years, this will be the first year that MLS will have not placed the majority of its teams into the playoff tournament.

All of these factors have a huge impact on the American game. Given that one just needs to make it into the postseason tournament to have a shot at a championship, a number of teams with losing records make it in every year. Indeed, last year's champion, Real Salt Lake, had a losing record and happened to flip a switch at the end of the season to make it into the playoffs and pull off an impressive run of wins once they were in the tournament. Also, given that there are a number of new franchises the last few years looking to make a splash, spending is way up for them yet they still struggle with the usual "expansion team" performance challenges. Finally, there is only the motivation of playoff seeding to push teams to compete for the top spots in the table. All these could potentially affect the drive of teams to spend money and resources to finish first rather than fourth or fifth in the table, thus making a relationship between payroll and performance harder to prove.

The Inputs

For this analysis I used 2005 through 2009 player salary data and MLS final table standings data.

As MLS is divided into two conferences (East and West) for the playoff format, I had to combine the two conferences for each season and assigned finishing positions based upon each team's total points for the season. Where ties in points existed, I awarded the teams the same position in the table and then skipped to the next finishing position for the first team after those that were tied. Once each team in each season had a finishing position assigned, I compiled the average finishing positions for each team.

I used the player payroll data to calculate each team's payroll as a multiple of the league average for the season. The team payroll multiple from each season was then compiled to make an average value for each team in MLS.

The results of these two compilations can be seen in Figure 1 below.

Figure 1: MLS average league position and payroll, 2005-2009

Just like the Soccernomics analysis, the data above is non-normal and must be transformed to perform any correlation studies and regression analyses. To do this, I initially tried the Soccernomics transformations of translating finishing positions to percentages as well as using natural logs and found that they worked. See Figure 2 below, where the p-value is greater than 0.05 and the assumption of normality is a safe one.

Figure 2: Graphical Summary for ln(p/16-p)

The team payroll data was also transformed by a natural logarithm, and we can now explore if there is any relationship between the data.

Correlation Test Results

As in my previous post on regression, the first attribute to check is the Pearson coefficient statistic before doing any regression analyses. Doing so will tell us if there is a statistically significant correlation between the two data sets. Figure 3 shows the results of the tests.

Figure 3: Correlation test between average team finish and team payroll multiple (with and without DP salaries included.

As Figure 3 indicates, there seems to be little chance there is a statistically significant correlation between team payroll and where the team finishes in the table as the p-values are not less than 0.05. What's interesting is that if the DP salaries are excluded (Team% no DP), the correlation statistics actually improves.

I did try a number of other transforms to the data to see if there was one that would generate improved fit. Unfortunately, none of the other transforms I tried improved the correlation statistics. Thus, I conclude there is no relationship between team payroll and table finishing position in MLS.

Reasons for the Lack of Correlation

Given the prominence of the Soccernomics analysis and the different conclusion drawn for MLS, here are some explanations why we might see such a difference in outcomes between the leagues.
  • The poor cost/benefit equation of the DP: While the DP sucks up a ton of available pay-roll (MLS salary cap guidelines not withstanding), it represents only a single player on the pitch. As we saw in the correlation statistic comparison, the statistical score actually improves when the DP's salary is removed. This is especially true of the LA Galaxy, whose blowout purchase of David Beckham and his $5M+ annual salary has resulted in two bottom table finishes followed up by an appearance in the MLS Cup in 2009.
  • The volatility in the league's makeup: There have been three expansion franchises added to the league in the last three years of the data used in the analysis. Two out of the three have tried to make a big splash by signing DP's, with one experiencing wild success in table position (Seattle Sounders FC) while the other has been in the league basement (Toronto FC). The Soccernomics study used a relatively stable list of teams that fought for positions in a mature league structure, which would provide less "special cause" variation seen in MLS's results the last few years.
  • Low sample size: As with all statistical tests, sample size is key. The greater the number of samples, the more forgiving the test is and the lower the threshold for concluding a statistically significant relationship exists. See Figure 4 below for an example of how the number of samples affects the critical test statistic. The highlighted column indicates the critical correlation values that a test must be equal to or greater than to ensure less than a 1% chance of error in assuming a correlation exists between two data sets. In the case of the MLS data I used, n=15 so one must observe a correlation statistic of 0.5923 or greater. As I stated in my regression post, the Soccernomics study had 58 teams included and thus only needed to observe a correlation statistic between 0.2948 and 0.3218 to make a conclusion of correlation.
Figure 4: Critical correlation value vs. sample size and significance level
  • The league's salary cap structure: Outside of the league's DP rule, MLS does try to maintain some form of a salary cap like most other American leagues. While America tries to pride itself as one of the most capitalistic societies, it's exactly the opposite in its sports leagues. In some ways, it makes sense. Capitalism fosters a system of cutthroat competition that eventually leads to a few winners and many losers. This can be counterproductive to providing a healthy, competitive league of 20-30 teams. Providing a ceiling on team payroll may help league parity, but it does make it difficult to rationalize expenditures in hopes of future success.
Ultimately, as MLS moves towards a stable 20 team league in the next few years (increased sample size) and the use of DP's becomes more rational with experience (improved cost/benefit equation) we may see the correlation statistic improve.

Next Steps

If the the main goal in MLS is not to win the table but to win the playoff tournament and the MLS Cup, what attributes could be considered in understanding the likelihood of winning the Cup? I will explore this topic in my next post. Until then, enjoy some soccer this weekend!

Tuesday, April 20, 2010

Euclidian Geometry and Goals

I am sure I am not the first soccer fan to pick up on this highlight, but it is just too sick of a goal that gets quantified by a mathematically competent commentator. Massive HT to my good friend Mike Ressler.

Arsenal are an "unusual observation"


The Zen Master who keeps Arsenal outperforming the model

Several weeks ago my fiance asked me the question below.
In a paragraph or less, why did you determine you like Arsenal?
You see, this is my first season being a supporter of Arsenal. I had followed soccer off-and-on earlier in my life, but I truly fell in love with the beautiful game during our local team's, the Seattle Sounders FC, inaugural season in Major League Soccer. The season was winding down, I wanted to continue my growth in following the game, and I had several friends that were Liverpool supporters. Naturally, I could follow their lead in watching the EPL but I had to find my own club to support. After some intense research and a few initial matches, I decided to become an Arsenal supporter. Hence, the question from my fiance as my first season as a supporter came to an end. My response is below, with the bold section referenced later.
First, I wanted a reasonably successful club to follow, but not a Yankees-style juggernaut. Arsenal also had a reputation of "beautiful, ball-control passing" soccer rather than a single superstar approach, which was of interest to me. Third, Arsene Wenger is a classically trained economist prior to being a soccer manager and is at the forefront of using detailed, obscure statistics to identify talent early and then develop them - that's cool to me. Finally, they are one of the few clubs in the Premier League to run a profitable business year in and year out through intelligent expenditures and resisting huge transfer fees.
A lot of this was based upon anecdotal or non-statistical analyses. It turns out that there is a statistical way to prove the bold sections above.

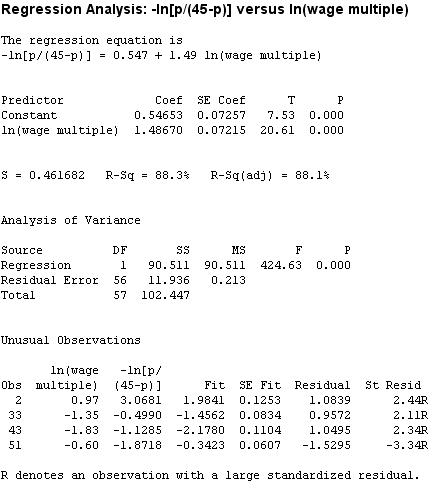
In my recreation of the Soccernomics regression there were a few additional results I did not publish in my original post. In addition to basic regression analysis, most statistical packages also highlight any "unusual observations" within the data set. Unusual observations are identified via three methods:
The statistics package I used for the analysis utilizes standardized residuals to highlight unusual observations. Any standardized residual greater than 2 indicates a data point of interest. The full regression statistics for the Soccernomics analysis is presented in Figure 1 below.

Figure 1: Regression analysis for Soccernomics data

The first entry under "Unusual Observations", Obs 2, corresponds to Arsenal's statistics. In this case, the model predicts a response (Fit) of 1.9841 based upon the measured value of 0.97 for the input of ln(wage multiplier). However, the observed value for -ln[p/(45-p)] is 3.0681. This provides a residual 2.44 times the standard deviation of the sample of residuals.

How significant is this gap? Translating the fit predicted by the regression, I get a value of 7.137. This translates to an average finishing position of 7th in the Premier League table. Instead of averaging 7th, Arsene Wenger's squad has average 2nd in the league over ten years on a relatively shoe string budget compared to Chelsea and Manchester United. Liverpool, who spends about the same amount of money as Arsenal, averages a 4th place position.

As I pointed out in my last post, all of the top four teams in the Soccernomics analysis outperform the predicted response of the regression analysis. Arsenal is the only one that statistically outperforms the other three in terms of getting a better bang for the buck. This is the statistical proof of what we Gooners have known all along - Wenger is one of the few managers to outperform the marketplace.

Note: As always, if you have any analyses you would like to see performed or friendly wagers settled, leave a comment on the open thread.

Sunday, April 18, 2010

Liverpool's not underachieving, they're just regressing to the Soccernomics mean


As delusional as Wall Street CEO's

I can't help but feel for Liverpool supporters these days. Their club, over a period of three years, has been run into the ground by negligent and uncommitted ownership. Reading more and more about their plans to exit Liverpool, I can't help but feel their ownership is as delusional as the Wall Street CEO's of 2008 about which I am reading. They have a team not going to the Champions League for the first time in many years, a squad saddled with £237M of debt, and Hicks and Gillett want to flip the club for at least three times what they paid only three years ago? That's the height of denial.

All is not lost at Anfield. What has been a rough season will see Liverpool likely finish sixth in the table. The reality is that this is not too far off from the Soccernomics prediction for that side's average payroll over the last 10+ years. The reality is that all of the Big Four - Arsenal, Chelsea, Liverpool, and Manchester United - outperform the Soccernomics regression equation. See Figure 1, where all four hover above the upper right of the regression line, indicating their actual achievement in the table is better than predicted. Liverpool is the dot in the lower left of the four - the one closest to the regression line.

Figure 1: Regression equation of table finish vs. wages with CI and PI

While the gap between the Liverpool data point and the regression line seems small, keep in mind that both attributes are plotted on logarithmic scales. A small change in wages leads to a large change in table position. Given that Liverpool has been outperforming the Soccernomics regression equation, where does the regression analysis predict they will actually finish on an average basis?

The answer depends on which aspect of the regression analysis you look at.
  • If one only looks at regression equation itself, Liverpool's finish this year isn't too far off from what the equation predicts. The predicted value for the y-axis given Liverpool's wage multiplier of 2.68 is 2.0121. Translating this y-value leads to an average finishing position of 6.94, or 7th in the table.
  • Another way to look at Liverpool's current situation is to look at the 95% confidence interval (CI) for the average finish position. This will communicate the likely extreme average one could expect given the variation in league finishing position. Using the same software package that generated the plot, the bottom end of the 95% confidence interval translates to a y-value of 1.7588, or an average finish position of 9.364. Rounding gives Liverpool an average finishing position of 9 in the worst case scenario.
  • Finally, one can look at the 95th percentile prediction interval (PI), which predicts the worst case individual finish given Liverpool's expenditures. This provides a y-value of 1.0532, or a worst case finishing position of 24.10. This would mean Liverpool would be relegated from the Premier League to the Championship. This highly unlikely, even given Liverpool's struggles this year. Thus we begin to see the limits of regression analysis and the distributions it generates.
Figure 2 shows the data referenced in the second and third bullet points.

Figure 2: Statistical output for CI and PI analysis based upon Liverpool wage expenditures

Liverpool's difficult season is really just a regression towards the mean. What their challenges point to are the ones likely coming for at least Manchester United and possibly Chelsea. Namely, to soar so high above the Soccernomics regression for so long, these teams have had to make ridiculous payments to players and saddle their squads with suffocating debt. It's unsustainable, and will self correct itself if UEFA doesn't take action first.

LinkWithin

Related Posts Plugin for WordPress, Blogger...