Tuesday, June 29, 2010

Evaluating Group Play Against the Soccernomics Model

I've spent a number of posts talking about the Soccernomics predictions for World Cup group play outcomes. Now that group play is complete, it's time to evaluate how the model did at predicting outcomes and which teams greatly over- and underachieved versus their Soccernomics predictions.

Ability of the Model to Predict Group Play Match Outcome

One way to judge the accuracy of the model is to look at its overall count of correct and incorrect predictions of outcomes. I have added a third category, "D" for draw, to capture when a push might occur in a situation where a wager is made on a specific match. Figure 1 captures this count.

Figure 1: Count of matches where Soccernomics predicted outcome of win/loss was correct (1), incorrect (-1), and when a draw occurred.


As one can see, the Soccernomics model correctly predicted the winner of 24 group play matches, or 50% of the matches played. The next likely outcome was a draw, with the least likely outcome being an incorrect prediction. This suggests that if wagers were involved in the matches, one could stand to make a good bit of money in wagers without spreads that also utilized pushes.

Of greater interest, however, is under what predictions the Soccernomics model is most accurate. How big does the predicted goal differential need to be to ensure a higher likelihood of predicting the correct outcome of the match? Figure 2 answers this question by using a cumulative distribution function (CDF). A CDF is used to show the likelihood (y-axis) of finding a value equal to or less than the one of interest (x-axis). In this case, I have plotted (1-CDF) to more clearly show the separation of the accuracy of predicted outcomes based upon predicted goal differential.

Figure 2: (1-CDF) for the Soccernomics model's ability to correctly and incorrectly predict a match outcome, as well as a draw.


Two observations can be made about the Soccernomics model's ability to predict outcomes in World Cup group play:
  • By a goal differential of 0.5, the model's ability to predict a "not loss" outcome is about 2:1. This gap grows as the goal differential progresses to 1.0. Any predicted goal differential greater than 1.1 means that the superior team will either draw or win the match with virtual certainty.
  • The closeness of the "correct" and "draw" lines indicates that the model's accuracy is not good enough to differentiate between a win or a tie. This makes the push all the more critical in a situation involving wagers.
The importance of a win in group play is even higher than expected given the roughly equally likelihood of drawing or winning with such high goal differentials. As SoccerQuantified.com points out, the number of draws in this year's group play was completely normal compared to previous competitions (although an abnormally high percentage came in the first matches).

Performance vs. the Model

Given the model's predictions, I have also quantified which teams have over- and underperformed the most versus the model. One measure of this is the average residual from the model - see Figure 3 for a plot of these average residuals in descending order.

Figure 3: Average residual from Soccernomics model by nation

One can see that four out of the top five teams made the knockout rounds (Slovenia being the exception), and eleven of the fifteen teams with positive average residuals made the round of sixteen. This left only five spots for the remaining teams, meaning teams with a positive goal differential residual to the Soccernomics model were twice as likely to make the knockout rounds than those who did not.

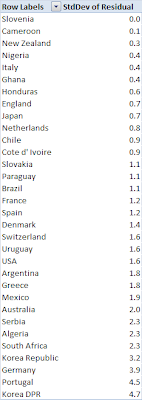
Another way to understand which nations performed most consistently against their Soccernomics prediction is to look at the standard deviation of their residuals to the Soccernomics model. Figure 4 summarizes this data.

Figure 4: Standard deviation of residuals from Soccernomics model by nation

Nations with the smallest standard deviation of performance to the Soccernomics model present a mixed bag of overall performance. New Zealand and Slovenia ranked high on both lists, indicating they consistently outperformed their Soccernomics predictions. Cameroon pretty much conformed to their Soccernomics prediction given their average -0.1 residual and low standard deviation. England and Italy, by ranking low in average goal differential and with a low standard deviation, consistently underperformed against their Soccernomics predictions. Also note that Portugal has the highest standard deviation, which indicates their top spot on the average residual list is likely due to the outlier of the seven goal barrage against North Korea. This means Slovenia's performance was likely the most consistent overperformance in the tournament.

If there is a Tom Thumb award to be handed out, it's a toss up between Slovenia and Uruguay. Slovenia deserves special consideration due to how small and new their country is. They have only two million people, with a much smaller population base of 20-30 year olds that could play in the World Cup. Uruguay deserves consideration for their high score on the average differential scale, and their win in the Round of 16. To win that match they had to overcome both the Soccernomics prediction and Footballer-Rating.com prediction that both favored Japan. They will face a challenge similar to what the US faced in the first round - a Soccernomics prediction that favors them but a Footballer prediction that favors Ghana. If they make it through that match into the semi-finals, they will truly be a Tom Thumb winner. Until then, Slovenia's high average residual and low standard deviation make them the winner.

Notes About the Round of 16

As I stated here, the Soccernomics model predicted smaller goal differentials for the Round of 16 - only one match had a projected goal differential higher than 0.6. In fact, the one game that did have a projected goal differential higher than 0.6 ended up being an incorrect prediction, although it did fall into the second most likely outcome for regulation time score (a 1-1 draw) based upon group play matches with a predicted goal differential of 1.0 or more. On the other hand, the Footballer-Rating.com method of looking at group play performance of the two teams to determine likely match outcome predicted the correct result in seven of the eight matches (Paraguay's win against Japan was the one outlier). This model seems to be a much better predictor of outcome in the early stages of the knock out round. It will be interesting to see if this trend holds. The statistics team at Footballer-Rating.com does not seem to be updating team performances based upon knockout round matches, which will force me to rely upon the group play data. I would have preferred to do a three match running average to capture the effects of playing against tougher opposition as the competition goes on.

Friday, June 25, 2010

Observations on the Round of 16

This time it will be much closer

It's been an exciting two weeks of group play, but now we know who is in the knock out rounds. We start things off early Saturday morning with the Uruguay/South Korea match and finish things up on Tuesday with a clash of the Iberian Peninsula.

In commenting on Round of 16, I will rely on two statistical methods for quantifying performance: the Soccernomics model for international matches that relies exclusively on demographic data, and the Footballer-Rating.com method that judges past performance in the tournament. The projected goal differential (Soccernomics) and average player rating by team (Footballer-Rating.com) are shown in the figure below.
Figure 1: Soccernomics and Footballer-Rating.com predictions for the Round of 16. Both scores are differences between the two teams expressed as (Left hand team - Right hand team)


As I mentioned in my last blog post, the United States/Ghana match is the only one where a team has at least a 1.0 goal differential advantage according to the Soccernomics model. Based upon matches with similar projected gaps, the US stands a good chance (11.5/16) to advance. Interestingly enough, the US/Ghana match also shows the biggest gap between the Soccernomics and Footballer predicted performances.

Per the original study that produced the Footballer statistical method, a differential of 0.75 or greater meant that the favored team had 3:1 odds of winning the match. This would mean that Ghana, Argentina, The Netherlands, and Spain are heavy favorites to win their first knockout round matches if they can maintain their group play form.

On the demographic front, there are some interesting points to be made.
  • Only 6 of the 16 teams has a GDP per capita less than $10,000, and all but one of those 6 are from Central or South America. Ghana, the poorest country in this year's tournament, is the one sub-$10,000 country not on the American continents.
  • At the opposite end, there are 6 teams with a GDP per capita greater than $30,000. This group consists of the four European teams left in the tournament, the US, and Japan.
  • Every team in the knockout rounds has played 400 matches or more of international soccer competition. This meant most of the African teams were doomed from the outset, with Ghana being one of the few African teams with the requisite experience to get through group play.
Finally, some commentary on the Germany/England match. This might be the most even match of the Round of 16. Soccernomics says it is dead even, while Footballer-Rating.com has the Germans coring 0.3 points higher on their scale during group play. Perhaps we should just be listening to this octopus after all, because the statistics are clearly a wash on this match.

Happy World Cup watching over the next four days, and go Team USA!

That's Why They Play The Games, Part IV

Time for some revenge for 2006, boys!

They were the richest of nations, they were the poorest of nations...

A description of tomorrow's USA/Ghana knockout round match might as well begin with a twist on that classic beginning to A Tale of Two Cities. Demographically the two nations couldn't be more different. Not only does the US hold a sizable advantage in wealth, but it also holds a huge advantage in terms of population. Let's dive into the numbers to see what Soccernomics can tell us about this match.

Population
  • Ghana: 23,837,000
  • United States: 309,488,00
GDP per capita
  • Ghana: $671
  • United States: $46,381
International Experience
  • Ghana: 389 matches
  • United States: 403 matches
These advantages translate to a predicted 1.0 goal differential in favor of the United States. In fact, this will likely be the largest projected goal differential of any match if the first round of the knockout stages. In the Soccernomics model at World Cup 2010, a projected goal differential of 1.0 is huge. Only 15 matches in group play, or less than one third, have been projected to have a goal differential greater than or equal to 1.0. Fourteen of those matches have been played so far, with today's Switzerland/Honduras match being the fifteenth. In the 14 matches so far, the record of the teams favored by one goal or more has been:
  • Wins: 9
  • Draws: 4
  • Loss: 1 (those plucky Slovenians over Algeria)
I don't have the statistics of how well the US and Ghana do at extra time or penalty kicks, but let's call it 50/50 so that the draws are split evenly. This means the US has at least an 11/15 chance of moving on if World Cup group play is any guide, and possibly as high as 12/15 if the Swiss meet their Soccernomics prediction and win today's match.

The one caveat to all of this is that Ghana is playing great soccer right now. As I noted in my last post, they have outplayed their opponents in group play to a greater degree than the US, but the gap is much smaller when you look at their absolute average team ratings (Ghana's 1.2 vs. US's 1.0). This should be a great match, and a great tuneup for whoever moves on to face the winner of the Uruguay/South Korea match.

There was a time late in the match on Wednesday when I thought I would never be posting a fourth installment of my series of posts. Anyone who tells you they felt differently, that somehow they hadn't given up hope in the closing minutes of that match, is either a liar or delusional about soccer. Landon Donovan's goal not only saved the US's run in the Cup, but validated what many of us believed to be true - this team is a world beater that deserves to be in the knockout rounds. Informed pundits and players around the world know this is a special team for the US, and they have got a good draw in the knockout rounds. They have accomplished goal #1, and can now pay lose and without fear. If they can beat Ghana, they have a good shot at running through to the semifinals. And if this team gets up a head of steam, they can be VERY dangerous. Just ask Spain and Brazil. I'm not saying they can win the Cup, but I am saying they can make a deep run and make the knock out rounds very interesting.

US Men's National Team, you've already made you nation proud and provided us with some of the most dramatic games of the cup. Thank you so much. Now it's all about continuing to shock the world. Let's go boys!

Thursday, June 24, 2010

Another (statistical) way to look at World Cup performance


I am always on the lookout for good statistical measures of individual soccer players' contributions to overall team success. This has been elusive for a number of years, whether it's due to the pace of the game or the desire of many to not sterilize the beautiful game with a (largely American) obsession with statistics. One of the more popular methods for looking at individual players' overall performance is the Castrol Index, but this metric is a much better measure of individual, and not team, performance.

Over the last several weeks I have read tweets that proclaim "New Statistical Method Quantifies Soccer Player's Performance" that often linked to a summary of the study from a news organization (like Forbes). Very few of the tweets link to the original study, likely due to its relatively deep mathematical and statistical theory. I've read several of the articles and the original study, and can tell you the news articles leave out much of the very powerful details of the study that can provide us some great insight into World Cup 2010.

Before I go into explaining the power of the study, I must comment on its methodology and approach to provide proper background. The study is completed from the standpoint of asking, "What do individuals do to make teams succeed?" Soccer offers a good method for evaluating such theories because it provides a quantifiable outcome (goal differential), yet many of the player's contributions are hidden by the few traditional stats available and the few goals made in a match. This forced the authors to examine players' contributions in ways other than scoring - namely successful passing and assists given the choices each player was presented with. This allows every player, except for goal keepers, to be evaluated for their effectiveness in contributing to the team's success. By creating their own scoring system for such passes and shots on goal the authors have developed a way to evaluate each player's contribution to the team's success or failure, as well as a correlated method for translating the average of the player's scores to a positive or negative goal differential. A more detailed reading, for those interested in the statistical theory, is available here.

The statistical method manifests itself in the graphical representation in Figure 1. The thickness of the lines defines the frequency with which such passes are made, the color the score of the pass or shot path, and the size of the player circles the overall player score. One can see in each of the 2008 Euro knockout matches that not only do Spain's players provide more accurate passing, but they also have a greater proportion of their players executing accurate passing.

Figure 1: Graphical representation of Spain's Performance in Euro 2008 knockout matches.

The studies findings are fascinating, as the authors demonstrate their new test statistic correlates well with actual match results. Those findings include:
  • The test statistic is defined as the difference between two team average scores in the study's new player score method. The authors are able to prove a statistically significant mean player score differential between teams where a win occurs versus a loss.
  • When testing for sensitivity of the test statistic in predicting match outcome, the authors find a statistically significant difference between win and not win or lose outcomes. This proves that the test statistic, as conceived, accurately predicts the team's likelihood of having won the match based upon the observed behavior.
  • In looking at the sensitivity of the test statistic, the authors found that Euro 2008 team performance could be accurately predicted by using the two highest scoring players on a team for the team average. This greatly simplifies any quick calculations one wants to make, and proves that most teams are only as good as their two best players.
  • The sensitivity analysis also showed that when the test statistic is greater than 0.75, the odds that the higher performing team wins the match are 3:1.
It remains to be seen if such a model is as accurate at quantifying World Cup performance as Euro 2008. The authors of this study are working to assess this attribute, and their real time scoring can be found here. Assuming that it does, there are a couple of interesting conclusions to be drawn from World Cup play so far.
  • Argentina, Spain, and Chile have been the best teams in group play so far as ranked by average rating difference. This is important, because the model showed that teams that played the best in group play tended to also play the best soccer in the knockout rounds of Euro 2008.
  • Lionel Messi tops the list of highest scoring players, but Brazil has five of the top ten spots.
  • As a preview of this coming Saturday's knockout round play, Ghana averaged a 0.7 team differential score vs. 0.3 average differential score for the US.
  • Portugal's 7-0 drubbing of North Korea only yielded a 1.4 average score differential.
  • The England/US match showed a 1.0 average score differential for England, which indicates the US was lucky to get out of the match with a goal.
  • Conversely, the US had a 1.2 average score differential benefit vs. Slovenia. Remember, the odds say that the US should have won that match three times out of four. Further rationale for why the outcome didn't truly represent the team's effort.
  • The US turned in their best performance of group play with an average player score of 2 for a differential of 0.6 vs. Algeria.
  • Finally, Clint Dempsey is the US player with the highest average player score.
If you're interested in further statistics, the Amaral Lab's Footballer-Rating.Com website allows anyone to look at team, player, or match statistics. I recommend you check it out, if for no other reason than to see how your favorite team might stack up against their first knockout round opponent based upon group play scores. It will certainly be interesting to see how this model works within the data generated at the World Cup, the findings of which will be published at a later date by the study's authors.

Wednesday, June 23, 2010

A few pictures from my side of the world

A well-deserved release of four years of frustration

I don't know if I have watched as fun and frustrating a match as what I witnessed live this morning. Everyone is familiar with the images from South Africa, but this match was also about Americans in every city coming together early in the morning to support our national team's efforts. I watched the match at The Market Arms in the Ballard neighborhood of Seattle, getting up very early to do some work so I could take the two hours to support the boys in South Africa.

The picture below, taken about half an hour before the match began, was taken from where I spent the entire match. I wanted to sit outside, as the inside was getting pretty crowded and we were experiencing our first decent weather of the summer. There's also something nice about having an Irish coffee on an open street at 6:30 AM.
The picture below, taken by a Seattle Times photographer, showed the bar's reaction to the game winning goal by Landon Donovan. I was just off to the left, where the door leads to the outside seating. To get a real sense of what Seattle reaction was like to that goal, see this video.

Wherever you were today, I hope you were able to enjoy the match. It's a once-in-a-lifetime experience, and we need to take time to appreciate it. Before long, it will be time to play every game like it's our last, starting with Ghana.

Tuesday, June 22, 2010

That's Why They Play The Games, Part III

The weight of soccer in the US is on their shoulders

Maybe I am being a bit overly dramatic. Soccer has flourished in this nation over the last 20 years without consistent success at the World Cup, and one set back here can't possibly stop that growing tide of support. It certainly can slow it, and a win would help accelerate it.
On the other hand, tomorrow's match against Algeria is that important. Win, and the team erases eight years of heartache - a time without a win at the World Cup. Win, and the team moves on to the knockout rounds, possibly as the top seed from its group. Win, and the team caps what would be considered a great 2010 World Cup group play campaign. Lose, and it is all over. Draw, and it's possible we back our way into the knock out rounds and go 12 years without a win at the World Cup. It's simple - win or fail to meet the public's expectations.

Building upon my two previous posts on the US team at this World Cup, let's see how the two nations stack up based upon the Soccernomics model.
  • Algeria: 34,895,000
  • United States: 309,488,000
  • Algeria: $4,027
  • United States: $46,381
  • Algeria: 250 matches
  • United States: 403 matches
The United States' nearly 10-to-1 advantage in population, 11-to-1 advantage in GDP per capita, and nearly 60% advantage in experience yields a 1.0 goal differential advatage. They'll need to maintain such an advantage to move on to the next round of play.
My personal prediction

I suspect that the Algerians will pour as much of their team into the US end of the field as they can for the first 15 minutes of the match. The US team concedes nearly 1/3 of the World Cup goals scored against it in the first 10 minutes of a match, and they have been true to form in the first two group play matches. The US team also has never won a World Cup match when their opponent scores first. These two facts combined have led to three wins in the last six World Cups. Alegeria will come hard and fierce, and the US defense will have to do what they haven't done so far in this World Cup - not allow a score before the 15 minute mark. If they do this, the US stands a good chance to win the match. If they don't, the best they can hope for is a draw.

I think the US team will surprise a lot of people in this match. Reading the few post-match interviews available after the Slovenia draw, I got the sense that the first half of that match was a wake up call to the team. Several reports indicated that the team took it upon themselves in the lockerroom to play to their full capabilities, the result of which was the flurry of the second half that should have seen the US win that match 3-2. That is in the past, but it provides a very effective motivator. These guys know what they represent, and it's more than just US players good enough to earn European league pay days.

They represent a turning point in our nation's love/hate relationship with soccer. There's something intangible out there in the US fan's psyche right now. We're tired of thuggish, spoiled, 'roided up players in our other professional sports, and we're longing for players who play for a love of the game, for national pride, and for a beauty that has been corrupted for too long by leagues and players bent on extracting a better contract or a better stadium deal. Our nation's love for the Cup and the sport, no matter what idiots like Glenn Beck and G. Gordon Liddy say, is measurable and it is growing. This game is much bigger for US supporters than making a knock out round. It's about legitimizing the love we have for our team, what they represent as sports professionals, proving the usual American soccer naysayers wrong, and showing what this game represents for those of us largely fed up with professional sports in America. I will be watching the match live, 7 AM Seattle time, and holding my breath for 90 minutes hoping for an American win.

My prediction is US 2-1, without conceding the first goal. Good luck, boys! And even though they may not be English, DON'T SHOOT UNTIL YOU SEE THE WHITES OF THEIR EYES!

Monday, June 21, 2010

World Cup Performance vs. Soccernomics Predictions Through Two Games

Continuing with my analysis I started after the first matches were complete, the table above reflects the average of the teams' residuals from the first two matches of group play versus the Soccernomics model. My spreadsheet used to calculate these values can be found here.

Germany's 0-1 loss to Serbia dropped it from the top position it held after its first match, and Portugal has now replaced Germany at the top of the list with their 7-0 clinic they put on against North Korea. I will single Slovenia out for unique praise later in this post. Uruguay, Paraguay, and Argentina all moved up with their performances in the second match, while the Netherlands and Ghana have maintained their positions from the first match. England, USA, and France all dropped substantially from last week as their either drew or lost in matches where they were heavily favored.

Slovenia's consistent performance versus the Soccernomics model deserves much praise. One way to measure this consistency is to look at the standard deviation of each team's performance. It's a bit straightforward right now given only two matches have been played, but will become more useful as we close out group play with the third match. The table below shows each teams' standard deviation of residuals to the Soccernomics model.


We can see teams like South Africa, South Korea, Germany, Portugal, and North Korea which experienced inconsistent results from the first to the second match exhibit the highest standard deviation in their goal differential residual. At the top of the list is Slovenia - showing virtually zero deviation in the first two matches. Slovenia is not only outperforming the Soccernomics model, but they are doing so in the most consistent manner.

Finally, we are beginning to get an idea of what the knockout round seeding will look like. The table below shows the current matchups as they stand after the second round of group play (click on the bracket to see a full view of the path to the World Cup championship match).


Only two spots (The Netherlands and Brazil) have been clinched before the third round of group play. Another three (Portugal, Argentina, and Chile) are virtual locks. That leaves 11 spots up for grabs in the final round of group play. We start with Mexico, Uruguay, Korea, and Greece battling for spots by looking for a win on Tuesday. The big Group C games come on Wednesday, which will determine which two nations - England, Slovenia, or the USA - move on. By Friday, we will be treated to Portugal vs. Brazil, Chile vs. Spain, and Switzerland vs. Honduras - all of which will impact the knockout round seeding. I suspect that the final seeding will look very different than my table above.

Enjoy this final, hard four days of group play!

Saturday, June 19, 2010

My reaction to the USA/Slovenia match

I see everyone grabbing everyone else. Where's the foul?

At the risk of deviating from my usual statistical discussions, I feel compelled to comment on the most exciting and controversial game in the World Cup so far. So much about the match goes to the heart of the game itself, which is my ultimate concern. Numbers are nice, but they're meaningless if the game isn't beautiful.

Other than a few tweets, I've generally restrained from commenting on the Slovenia/USA match. I am not interested in sounding like a sore loser, and while there certainly appeared to be plenty of bad officiating it is always best to wait a day or so to see what kind of opposing points of view might emerge. In doing so, one gets a complete picture and makes a more informed commentary. In this case, I must mention how grateful I am for Erik Renko's feedback.

Erik started following my twitter feed a while ago in the run up to the World Cup. Erik being Slovenian, he and I were bound to have some interesting discussions about this inevitable group play clash. As my previous posts indicate, I have a healthy bit of respect for the Slovenian national team for outperforming the Soccernomics model. The discussions with Erik, and the insight he has provided me both pre- and post-match into the Slovenian supporter psyche, have been a wonderful experience made possible by our Web 2.0 world. If you want great soccer insight, I suggest following Erik.

To begin my reaction, I must refer to this NY Times blog entry that Erik sent me this morning. In it, the author provides some pictures and video that show some of the grabbing and pulling by the US team that may have led to the referee's call to disallow the goal. The author of the blog post argues half tongue-in-cheek that there might be some offenses worthy of such a call, while also acknowledging that similar actions were being taken by Slovenian players.
I think any objective fan can look at the two photos and agree that there was a lot going on during that free kick that isn’t allowed. So maybe some of us didn’t like what Coulibaly saw, or that he chose to pluck out a foul by a United States player instead of one against a United States player. But you can’t say nothing happened.
While there certainly are such offenses on both sides, I fall on the side of the referee not taking action for the exact reason that everyone was holding and grabbing. The Slovenian player holding Michael Bradley was probably the worst offender from either team, and Maurice Edu's footwork for the goal really didn't seem to benefit from any US player's hold. In fact, it was quite the contrary as he too was impeded (even though the official FIFA ruling said the foul was by Edu). On balance, it looks like the usual pushing and shoving on a set piece that should have resulted in a no call.

These pictures and the insight they provide also bring up the sensitive topic of instant replay. Many in the United States are used to instant replay due to its use in American football and to a lesser degree in basketball, hockey, and baseball. Many would like to see it applied to soccer for situations like those in the USA/Slovenia match. There are a lot of logistics for instant replay - would it be reviewable only by FIFA officials in a booth upstairs, or would managers have the ability to throw a flag to challenge a call a la the NFL? To me, any implementation would be a travesty of the first order because it wouldn't really resolve the subjectivity of fouls in soccer. Applied directly to this case, what would be the grounds for reversing the prior call? As already discussed, other than Landon Donovan who was taking the free kick, everyone was violating the rules of soccer in some way or fashion on that set piece. It's likely the call would have stood, and would we really want to stop the game for five minutes for an equally arbitrary reversal based upon one of the likely ten infractions committed on the play? This is where the American fan needs to think like a global fan, respect the game as it is on this topic, and move on.

The emphasis shouldn't be on instant replay, but instead on better officiating. I don't hold any conspiracy theories about this referee, but I have read enough to know this isn't Koman Coulibaly's first run in with controversy. The call against the US goal also wasn't the first questionable call in the sequence, and much of the match was marred by inconsistent officiating that often didn't make the calls that should have been made. No cards or fouls were given to Clint Dempsey's body slam of a Slovenian defender, nor Slovenian defenders' several tackles at the edges of the penalty box. The card given to Robbie Findley for a handball in the first half was ludicrous. In general, the first half was light on cards while the second half saw Coulibaly dealing them out as if they were going out of style. It's clear to me that Koman Coulibaly isn't experienced enough nor has good enough discernment to be a World Cup official. He reminds me more of the quality of referee we have to deal with in MLS.

Finally, Erik was able to relate how the second half of the Slovenia/USA match was deja vu for Slovenian fans. In Euro 2000, Slovenia went out to a 3-0 lead before conceding a draw after Yugoslavia came back with three goals later in the match. Erik used this as an example of a "lack of finishing instinct" in the relatively new Slovenian national team. As he said,
[Number] of [international] matches, short history and relative lack of winning habit prevented [Slovenia] from winning [the] match vs. USA.
As I said in my response,
Oh that darn third term in the Soccernomics equation!
It's clear to me that if the Slovenian team continues to outperform expectations, it will get the necessary experience it needs to close the gap it has to the other European national teams in its backyard. Regardless of the bad officiating, I have acquired a healthy respect for the Slovenian national team. We Americans like underdogs, and we love to embrace nations like Slovenia who have successfully transformed their nation since the fall of authoritarianism. Sadly, this match may mar many US fans' outlook to a team we all should be rooting for if they make it to the knockout round.

Friday, June 18, 2010

2010 MLS Salaries: No overall movement, Forwards the best paid


I am taking a break from the World Cup this evening to provide some commentary on the 2010 MLS salaries that were released earlier this week. Much has been made of the fact that the injured David Beckham still tops the list with a $6.5 million salary. What is more important to examine is what has happened with MLS payroll from 2009 to 2010 with the new collective bargaining agreement, and to understand which types of players are paid more than others. This is a continuation of a series of posts I made back in March.

It should be noted again that the salary data is not normal. Thus, I use the Mann-Whitney test to compare the 2009 and 2010 data sets to see if there are any differences in their medians. In the case of the team payrolls, the medians are:
  • 2009: $2,823,007
  • 2010: $2,759,648
Putting the data into the Mann-Whitney test yields the results below.

Mann-Whitney test results for 2009 vs. 2010 MLS team payroll

The results of the test show that the wide prediction (CI) for ETA1-ETA2, with the resultant negative value for the bottom end of the window, means that there is not a statistically significant difference between the payrolls in 2009 and 2010.

After determining there is no difference between the two years, the effects of position on player salary was examined. The MLS players union data was grouped into three bins - F, D, and GK. Any intermediate positions marked with an "M" were binned into the corresponding F or D groups. This yielded the following median values (player position salaries were also non-normal):
  • Forwards: $96,000
  • Defenders: $78,038
  • Goalkeepers: $69,833
Figures 2 and 3 represent the results from Mann-Whitney tests using the F, D, and GK data.

Figure 2: Mann-Whitney test for Forward vs. Defender salaries

Figure 3: Mann-Whitney test for Forward vs. Goalkeeper salaries

As Figure 2 indicates, pay for forwards vs. defenders is higher and by a statistically significant measure, with the predicted gap at $6000. The same is true for forwards vs. goalies per Figure 3, with the predicted gap growing to $8208. It turns out that a test of defenders vs. goalkeepers shows no such statistically significant difference.

To me, it makes sense that goal scorers like the forwards get paid the most money. They not only win games, but also put butts in the seats. What's a bit shocking to me is how goalkeepers end up being the lowest paid position. I would think that the few number of them on a squad and their critical nature in a match would lead them to be better paid than defenders. Perhaps its a quirk of MLS's salary structure, but I would invest more in goal keepers than average defender salary.

On a personal note, it's sad that many technical professionals or people with advanced degrees in our nation make more money than an MLS defender or goal keeper. The attractiveness of MLS is that their players are not spoiled brats like our other professional leagues. Still, we can accomplish that goal while also upping league pay and quality of play.

Wednesday, June 16, 2010

That's Why They Play The Games, Part II

This is what a potential giant killer looks like

This Friday the US Men's National Team resumes its quest to qualify for the knockout round in the 2010 World Cup. Winning this match would not only instantly erase the memory of the winless campaign in 2006, but it would also allow the US to control its own destiny within the group. A draw is not a disaster, but also not preferable. A loss, and Bob Bradley's boys are in deep trouble.

This is also a very different match psychologically than the England match. The US is the clear favorite going into this match. They cannot be happy with coming away with a draw - the pressure is on for a win. And the weight of an awful 2006 campaign all comes down to this one match. What a difference six days make - the high of the draw against England must be forgotten and winning this match must be all that matters. How will this impact the play of the US team, which is not accustomed to be under such pressure?

So how would Soccernomics evaluate this match?

Population
  • Slovenia: 2,059,470
  • United States: 309,488,00
GDP per capita
  • Slovenia: $24,417
  • United States: $46,381
International experience
  • Slovenia: 73 matches
  • United States: 403 matches
All of this adds up to a 2.0 goal differential in favor of the United States. In this case, I would argue that the Soccernomics model is way over-predicting the likely outcome. Slovenia is a scrappy team always happy to play the upset role in a tournament. Nothing would make them happier than to take down the US, breaking up the US/England duo that nearly every commentator has seen coming out of Group C since the tournament seeding was announced. If the US doesn't play smart soccer, better defense than the first fifteen minutes of the England match, and make great attacks they may find themselves effectively eliminated from the tournament by the end of the day if they lose and England defeats Algeria.

My personal prediction, as a hopeful fan of the sport in America, is that the US team wins the match 2-1 and begins to convince the world and our nation they are for real. Either way, it should be a great match.

On the other hand, you could be like my tweep Boco_T, blindly follow the Soccernomics prediction, and end up getting the score dead on while most took the other team big.

First Game World Cup Performance vs. Soccernomics Predictions

Building upon my previous post, the table above shows the residuals for each team after their first match (except South Africa and Uruguay, who played their second match today) in the 2010 World Cup. A residual is the difference between an observation (goal differential in the first match) and the predicted value of the model (predicted goal differential of the first match according to the Soccernomics model). Residuals are useful in:
  • Determining which observations are over- or under-performing versus the model
  • Determining whether the model (regression equation) satisfies the statistical tests required of it

I will continue to use the residual approach to quantify how each team is doing against their corresponding Soccernomics predicted performance as both the second and third matches are completed for all teams. At the end of group play, I will be able to comment as to which teams were the biggest over- and underachievers in the tournament, as well as comment as to whether or not the Soccernomics model actually applied well to the tournament.

Before getting to that point, however, we can gain some useful observations from each team's first match. Germany's top position in the list, given a 4-0 drubbing of Australia, is not a surprise. As I have said in previous posts, Slovenia can easily play this tournament's "giant killer" role if they keep up their great start and tie or beat the US and England. Finally, even though the Dutch and Danes only had a 0.2 predicted goal differential, Holland's 2-0 win moved them to the third spot in the ranking.

At this point, as only one game has been played, the list is basically a reflection of who won and lost. The bottom three teams are the teams who lost to the top three - the bottom half is an inverse of the top half. As group play goes on, this list will get more jumbled and I will provide commentary as to the bottom three teams.

Finally, how about the Swiss upset of Spain today? Spain, favored by nearly a full goal in the Soccernomics model, finds itself in the bottom of the rankings around Algeria, Serbia, and South Africa. They will be playing catch up to Chile and Switzerland the rest of the way, hoping one of them stumbles in their next two matches. Perhaps there is hope for the rest of the world against the Spanish juggernaut that the press wants to prematurely crown champions.

Monday, June 14, 2010

World Cup & Soccernomics, Day-by-Day

In this earlier post I mentioned my friend's basic World Cup template that users can modify to suit their own purposes. I have done so, blending the GDP, population, and international soccer experience statistics from an earlier post to integrate the Soccernomics model results for each World Cup group play match. Using a bunch of VLOOKUP functions and pivot tables, I can get a good snap shot of summary statistics - both from what the model predicts and how each team does against the model. My work-in-progress spreadsheet can be found here.

I will use this spreadsheet throughout the tournament to comment on which teams are over- and underachieving against their predicted, historical average. The first attribute I'd like to highlight is which teams have the most and least difficult group play in the tournament based upon the Soccernomics model. Predicting the goal differential for each match and then using a pivot table to derive the average value for each team produces the table below.


As I mentioned in this post, Slovenia will be giant killers in this year's tournament if they can hold their own against the USA and England in their final two matches. What also jumps out at me on this table is the shear number of African nations at the top of the list - those facing the toughest climb. It speaks volumes that Ghana has been able to win, while all other African nations have either lost or drawn their matches.

In the next day or two I will post on how I will evaluate how each team performs versus their Soccernomics model prediction.

Sunday, June 13, 2010

Two (possibly) unlikely sources

As I have ramped up my work on this blog, my friends have come to see me as a bit obsessed and overwhelming in my pursuit of soccer statistics information. Often times they send me emails with the subject line "You may have heard this, but..." What's funny is that often times these emails contain links I have not read yet, simply because there is such a wealth of information out there on this topic.

I have found a common theme though - most often these links come from blogs or other sources that don't normally cover soccer statistics. They may now be covering the topic with a post due to the World Cup, or maybe they are in a related field and are simply observing how much the field is taking off. Either way, they are a bit off my radar as I am focused on soccer-specific reading.

Here are two such links that I received in the last few hours just to demonstrate the range of people getting into the discussion.
  • FiveThirtyEight.com (HT: Travis): The statistics blog of politics was the main contributor to ESPN's Soccer Power Index, and has their own World Cup simulation results here. It seems as if their model is in the same vein as the Sports Club Stats sites I love so much - take performance to date, look at a statistical predictive model of future potential performance and likelihood of realizing them, and map out the statistical chances of a certain outcome happening.
  • Freakonomics Blog (HT: Daniel): It's only natural that what many consider the namesake for the most popular soccer statistics book right now provides some commentary on soccer statistical theory. In this radio edition of the blog the discussion centers around studies on what stadium configurations produce the most significant home field advantage, and the reasons why a player taking a penalty kick doesn't take the best shot possible - simply shooting down the middle of the goal.
Keep the links coming. I am certain I haven't read them and would love to learn from them and possible post them here.

Outperforming the Soccernomics model: Slovenia and Ghana

Yes, the Slovenian goal was that big of a deal.

In a recent post I commented on how the Soccernomics model for predicting international competition goal differential applied to the England/USA match. In this post I will use that same model to show how big the wins by Ghana and Slovenia were in this weekend’s World Cup competition.

Ghana and Slovenia represent two ends of the Soccernomics model spectrum – some might say the wrong ends to be on if you want to succeed in international soccer. Slovenia is perhaps the newest team on the block, having played the fewest international matches of all the participants in this year’s competition. This is due to the fact that they only became a nation in 1991 as a consequence of the breakup of Yugoslavia (I have chosen to assign the Yugoslavian matches to its biggest successor – the nation of Serbia). Interestingly enough, Slovenia does possess a moderate amount of wealth and thus has a reasonable GDP when compared to other nations. Ghana, while having over fifty years of international soccer competition under its belt (nearly ten times the matches of Slovenia), is the most impoverished nation in this year’s World Cup. While Slovenia pays a far bigger price for its lack of experience in the Soccernomics model, both nations are often the underdog when using the model to predict match outcome. Let’s see how big of a disadvantage each team faced in their first matches.

Sources of Data

Before going much further, a comment must be made about the data sources used in this analysis.

  • GDP: Throughout this post, I have used IMF data found in this Wikipedia article.
  • Population: Throughout this post, I have used the data found within this Wikipedia article. As one can see, there is no real authoritative source for population data – the list is compiled from several reliable sources. The Slovenian government and UN estimates were used as sources for the populations of Ghana, Slovenia, Serbia, and Algeria.
  • International Experience: This is perhaps the weakest data set in my study. I have used Russell Gerrard's AIFR data set, which was also used by the authors of Soccernomics. The main liability of this data is that it is only current through 2001, thus the last nine years of experience are not included in my analysis. This means that a few of the ratios, especially for a country like Slovenia where over half their experience is missing from its total international match count, are a bit off. This risk is somewhat mitigated through the use of natural logs in the model. As an example, doubling Slovenia’s experience and assuming Algeria played no matches between 2001 and 2010 reduces Algeria’s goal differential advantage by 1/3. That means that any observation we observe from the model is still likely real and significant. The risk continues to decline as more established teams (i.e. Ghana and Serbia) face each other. If anyone has any ideas where I might find data for international matches between 2001 and 2010, I am all ears.

Ghana vs. Serbia

This match represented the second chance for an African nation to claim a full three points at the first African World Cup. Before ever starting the match, the Ghanian team were underdogs, but just how big?

Population
  • Ghana: 23,837,000
  • Serbia: 9,850,000
GDP per capita
  • Ghana: $671
  • Serbia: $5,809
International experience
  • Ghana: 389 matches
  • Serbia: 578 matches
Serbia has nearly a nine-fold advantage in per capita GDP, a nearly fifty per cent advantage in international experience, and a nearly a two-and-a-half-fold disadvantage in population. This equates to 0.5 goal differential advantage for Serbia – certainly an advantage, but not a huge one. Thus, the victory by Ghana, representing a 1.5 goal residual from the Soccernomics prediction, may be more symbolic in its overperformance.

Slovenia vs. Algeria

Slovenia has played the role of world beaters over the last decade, making shocking runs in Euro 2000, qualifying for World Cup 2002, and defeating the Russians in the European playoff for qualification at World Cup 2010. Just how big of an underdog were they in the opening match?

Population
  • Slovenia: 2,059,470
  • Algeria: 34,895,000
GDP per capita
  • Slovenia: $24,417
  • Algeria: $4,027
International experience
  • Slovenia: 73 matches
  • Algeria: 250 matches
Slovenia’s population is clearly better off economically than their former Serbian brethren as well as their Algerian opponents. However, they suffer greatly in the Soccernomics model with less than one tenth the population and one third the international experience of Algeria. This translated to a 1.0 goal differential advantage for Algeria. Slovenia’s victory, which translates to a 2.5 goal residual for the team, is huge. If Slovenia can tie or win against the US (1.7 goal advantage) and England (2.3 goal advantage), it will have likely completed one of the best performances against the Soccernomics model of all the teams in this year’s World Cup.

Friday, June 11, 2010

MLS Attendance 2010: Getting the statistics right


This is what 36,000 fans each week looks like. Not every club is so lucky.

I am focused on World Cup like everyone else, and I am working on a nice little spreadsheet and post to accompany my viewing experience. But I must take this opportunity to provide some statistical commentary.

As a US soccer fan, I am all for the sport's growth and Major League Soccer plays a key part in that growth. Everyone is hoping for a big bounce in MLS's profile this year due to the World Cup, so I was naturally excited when MLS Daily came out with a post trumpeting 10.8% growth at MLS match attendance. The problem is that after a closer examination of their numbers, I find that their calculation method is wrong and that the actual attendance growth is far less. Let me explain.

MLS Daily's method is simple, straightforward, and one that the average fan might make. They take the 2010 average attendance through 93 games (16,472) and divide it by the 2009 average attendance through 91 games (14,862) to get the 10.8% growth in attendance. The problem is that this violates the basic rule of statistics: it's not the average that matters, but the distribution around the average. The correct way to calculate the average increase in 2010 MLS attendance vs. 2009 MLS attendance is to answer the following two questions:
  • Is 2010 MLS attendance statistically significantly higher than 2009 MLS attendance?
  • If so, by how much?
To answer those two questions, we must look at each individual team's difference and not the league average.

The Statistics

To answer the first question, I first must develop the 2009 and 2010 attendance figures by club. This is easy if I trust the MLS Daily numbers by club. In this case I do trust them, and I divide the 2010 numbers they have published by (1 + % change from 2009) for the respective clubs. That gives me this breakdown of 2009 and 2010 attendance (deleting Philly, of course). We're now ready to make some comparisons.

What's the first rule of any statistical analysis? That's right: check for normality. Neither data set tested normal (which is the key assumption the MLS Daily analysis relies upon yet violates), so I looked to see if I could get both data sets to be normal via a common recommended Box-Cox transform. No luck again. It's time to turn to the Mann-Whitney parametric analysis.

The Mann-Whitney test uses medians, not means, to evaluate the difference in two populations - in this case, 2009 and 2010. That allows it to evaluate non-normal distributions. Using the Mann-Whitney test can allow us to understand whether or not a statistical difference exists and how big it is.

The Results

Running the Mann-Whitney test yields some interesting results. Figure 1 shows the results of the test.

Figure 1: Mann-Whitney test results for 2009 vs. 2010 MLS attendance

As the last line of the test indicates, the difference between the two seasons is significant which means the 2010 season has seen an increase in attendance. However, the difference is only 802 people which yields a 5.5% increase in attendance - nearly half of what MLS Daily claims. What's astonishing is that if you look at the likely spread in differences (95% spread to be exact), almost 2/3's of the likely difference is negative. That means that while the observed values indicate a likely attendance growth, they don't rule out a possible attendance drop given the poor showings in some cities.

Getting these statistics right is very important. MLS is on an expansion plan the next several years - Vancouver and Portland in 2011, and Montreal in 2012. Expansion is important, but key established teams are suffering: New England and San Jose are both down double digits versus last year. Expanding too quickly can hurt the existing teams, and stunt league growth. It's important that MLS and its fans have a realistic view of its growth from one year to the next to ensure club and league viability.

Wednesday, June 9, 2010

That's Why They Play the Games

The ghosts of World Cup 1950 that will stalk England on Saturday

The Rematch is almost upon us, and it's only appropriate that I turn to the Soccernomics model for national team performance to provide a prediction of the possible outcome. If two teams, i and j, face each other the Soccernomics model uses the following equation to predict goal differential:

GD(ij) = 0.137 ln[pop(i)/pop(j))] + 0.145 ln[GDP(i/GDP(j))] + 0.739 ln[exp(i)/exp(j)] + 0.657 for home team

In the case of England and the US, no one is the home team so we can drop the final term in the equation. Now we turn to the population, GDP, and experience terms.

Population
  • England: $35,334
  • United States: $46,381
Experience:
Plugging these variables into the above equation yields a 0.203 goal differential advantage for England. England greatly benefits from their nearly 2-to-1 advantage in international experience that counts nearly six times as much as the other variables. For all the smack talk from English fans, this is hardly an advantage in the World Cup.

This match will likely be far more even than some would think. It's certainly within the United State's capability to win it. Both teams are in top form, and everyone is hoping for an outstanding clash worth the 60 year wait.

I have only one thing left to say.

"DON'T FIRE UNTIL YOU SEE THE WHITES OF THEIR EYES, BOYS! BEAT ENGLAND!!!"

LinkWithin

Related Posts Plugin for WordPress, Blogger...