Thursday, July 29, 2010

Why Paul the Octopus Was No Better Than A Coin Flip

No better than flipping a coin.

Call me a kill joy. Say that I don't like to have fun. That's fine with me, but I couldn't get behind the stupid Paul the Octopus movement (even though he has an iPhone app). Frankly, the obsession with Paul was just the latest demonstration of how little the worldwide population understands statistics and looks for meaning in expected outcomes.

One of the core concepts in statistics is that for a model, data set, or set of predictions to be significant they must be substantially different enough from a basic assumption (the null hypothesis). To pull a quote from an earlier blog post,
Six of the seven past World Cup winners were governed by dictators in the last 80 years, England being the exception. That means around 86% of World Cup winners have had dictators during the World Cup’s eight-decade run. Fine. But that number is only interesting if it’s significantly higher than the percentage of all competing countries to have had dictators during the same period; otherwise it’s just an artifact of the historical reality that most countries have had dictators in the last 80 years.
Paul the Octopus and his followers suffer from the same problem. Let me explain...

In this case, a rational person looks and Paul and realizes that he should be no better than flipping the coin - he's got a 50/50 chance of getting things right as he has no real knowledge of the match nor its participants. The one caveat to that is that we're assuming that there's no bias being introduced by his handlers, the arrangement of the boxes, where he's at in the tank when the boxes are dropped, or at least another dozen or so factors that might influence which box he opens. For the sake of the exercise, let's make the assumption for now that there is no bias and come back to it later.

If we start with the assumption that Paul is no better than a coin flip, we can evaluate how good he was at picking the winners and whether or not he was better than what we could expect from flipping a coin.

Many people have focused on the fact that he got eight match outcomes correct. The chances of doing this are 0.5^8, or 0.4%. While impressive, the statistics suggest this is only marginally better than an outcome of coin flips.

Statisticians have the ability to determine how powerful a data set is compared to a known phenomena. They also have the ability to do the inverse - to define a desired power of a data set and the difference they would like to prove from a null hypothesis to understand what trend must be observed in the data to prove such a powerful relationship. This can be done many ways, but I used Minitab's "Power & Sample Size" function.

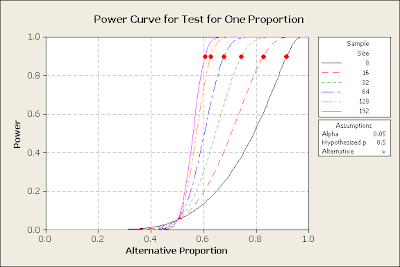
When performing such power and sample size analyses, statisticians often use a power of 0.9. This means there is a less than 10% chance of drawn the wrong conclusion of a statistically significant shift in the data set when one really isn't present. I used this assumption when looking at Paul's picks. I used that power, the fact that he picked eight times, and asked Minitab what proportion of his picks had to be correct to prove he was better than the average outcome of picking winners based upon coin flips (i.e. 0.50). The outcome of that analysis is in Figure 1.

Figure 1: Power vs. observed proportion of Paul's predictions that were correct

Figure 1 shows the power one can derive from an observed population based upon the proportion of correct predictions of a sample size of eight. In the case of Paul's eight guesses, he needed a greater than 90% success rate (the red dot) to prove that he was better than flipping a coin. That is to say that with such a low sample size, seeing a coin accurately predict the outcome of 7 of 8 matches is not outside reasonable statistical expectations. Paul had to nail all eight predictions to be better than a coin flip - one screw up and he was meaningless.

My analysis and argumentation would have been much easier if Paul had screwed up one of the final match predictions. (Side note: I would have also been happier too because it meant the Dutch would have won the World Cup.) Nevertheless, examining what happens when we increase the sample size and the precarious position Paul was in provides a great example of why statisticians must see large sample sizes to feel comfortable with their analyses.

Let's say Paul hadn't retired from making soccer match predictions, and he could live long enough to see several World Cups. He'd have to restrict himself to predicting knock-out round matches, as he'd surely get burned by the ties in the group play stage. This would allow him 16 matches every four years that he could provide predictions. Running the "Power & Sample" size function in multiples of 16 yields Figures 2 and 3.

Figure 2: Power and Sample Size Table

Figure 3: Graph of Power and Sample Size

One can see that as sample size increases, the required proportion of correct guesses drops. If Paul had provided predictions to all 16 of the 2010 World Cup knockout matches, he could have only made two incorrect predictions before he was no better than a coin flip. After two World Cups, he could only get 8 wrong (out of 32) and still be better than flipping a coin. Twelve World Cups in, he would have to maintain better than a 60% success rate to be better than flipping a coin. My money would have been on him screwing up more than two picks in the other eleven matches he didn't predict in the 2010 World Cup knock out rounds.

Beyond Paul's followers essentially having faith in nothing more than a coin flip, there's the question of bias in Paul's predictions. If you go back and watch the videos, you see that he unquestionably favors the box on the right no matter where he is at in the tank. Others have theorized that he favors reds and yellows. No matter what the bias, it would have been discovered if Paul's owners had done a proper measurement system analysis (MSA). An MSA helps the statistician understand how much the measurement system contributes to any variation in observations versus the actual variation in the measured quantity. This process helps identify and quantify bias. This is especially important with inferred measurement systems like Paul's predictions. I am sure that if they had done an MSA they could have discovered where the bias was coming from, if there was one.

Paul's fame forced me to tear him down. He's earned my BS Stat of the Day. While my dislike for him may be much for some of my readers, it apparently pales in comparison to the death threats the whack job leader of Iran has issued against him. This is soccer and statistics, not a geopolitical power struggle.

Thursday, July 15, 2010

Taking a Break

Blog postings have been light since the World Cup wrapped up, and there's a reason for that. I am getting married Saturday, and much of this week has been dedicated to wedding preparations. I also plan on taking next week off to enjoy some low stress time with my new wife.

I'd like to take this opportunity to thank all of my regular readers. You guys have made the last several months very interesting, and I am excited on daily basis to bring you more data driven analysis of the soccer topics of the day.

Upon my return I will pick up my MLS coverage as we head into the critical second half of the season. The Premier League starts back up in August, and I will be providing some preseason statistical commentary.

I'd also like to request your help - I'd like to increase my presence on the web and within the soccer blogger community. I've added a Stumble Upon widget to the bottom of the posts. If you have a Stumble Upon account and like a post I make, please feel free to click on the widget to add it to Stumble Upon's library. If you know of any other tools I should be using to increase my web presence, please let me know. I am all ears.

With that, I hope you all have a wonderful week and a half. I will see you on the backside.

- Posted using BlogPress from my iPad

Location:NW Myhre Rd,Silverdale,United States

Tuesday, July 13, 2010

A Final-Footballer Rating Look at The World Cup

Perfect game plan, imperfect result


I have precious little free time this week as I am getting married on Saturday. Whenever I am not at work I am working on the last critical items for the wedding. I do feel compelled, however, to comment on what I think is undeserved criticism of the Dutch team's performance in the final.

Let's get one thing straight. Any team in the final has one purpose: to win the match within the confines of the rules of the sport. When a team encounters a finesse/rhythm/passing squad like Spain, they have two options for victory. They can either try to match that team's strategy (if they feel they have the talent to do so), or they do their best to disrupt the other team's strategy and pounce on the mistakes. From the outset of Sunday's match, it was clear the Dutch were pursuing the latter strategy.

To make the latter strategy succeed a team must be relentless and ruthless in their physicality. I am not talking about Ryan Sawcross or Nigel de Jong ruthlessness, but I am talking about fair challenges that push the limits of yellow card territory. You have to make every player think they are about to be hit as soon as they touch the ball. Doing so not only makes them less likely to complete an attacking pass, but it makes it far more likely they'll make a bad pass that sets up a counterattack. I am an Arsenal supporter - this type of tactic is the MO of every lower level squad our team faces in the EPL. I am the most likely to gripe about its application, but as long as the challenges are fair it's part of the game. You can't dictate how the opposition chooses to engage you.

And you know what? The Netherlands' strategy worked perfectly. See Figures 1 and 2 below, which plot each semi-finalists' Footballer-Rating absolute and differential score in each World Cup match they played.


Figure 1: Footballer-Rating score differential by match (dashed line represent three match moving average)


Figure 2: Footballer-Rating score by match (dashed lines represent three match moving average)


Looking at Figures 1 and 2, one clearly sees that Spain had their worst match of the tournament in the final. This is especially true when one looks at the running average, where the only time the Spanish average takes a dive is after they play the Dutch. Passing efficiency for a number of Spanish players was off by 10% or more compared to their match against Germany, and far fewer Spanish players had an efficiency rating of 80% or higher against the Netherlands. The Dutch disrupted the Spanish team's rhythm, and when Spain is winning all their knockout round matches 1-0 such disruption makes a win for the opposition possible.

FIFA, ESPN, and commentators around the world can gripe all they want about the Dutch play in this match. They can call it ugly. They can call it dirty. They can claim it will dull the acceptance of soccer in the US. They can make all the claims they want. What they can't claim is that it was ineffective because the numbers don't support that claim. Quite simply, the Dutch were the most effective at disrupting the Spanish style of play that has shredded the world over the last two to three years. If not for a missed Dutch opportunity or two, we never would have gone to extra time and would instead be talking about how brilliant of a game plan was executed by the Dutch.

The goal of any soccer game is to win within the bounds of the rules. If it produces a beautiful match in the process, that's great. Let's not let our obsession for "the beautiful game" lead us to penalize teams who come up with the best strategy to use against their opponent that doesn't fit within our narrow view of the game. Let us celebrate diversity of tactics, a near perfect game plan to take down a soccer juggernaut, and that juggernaut's impressive patience to score a late goal after nearly two hours of such physicality.

This is how I will choose to remember this World Cup and its final match. How about you?

Update: Only a few hours before I made this post, Soccer Quantified made a similar post that looked at each team's foul count during the tournament and their relative success at winning matches, their total points during group play, and their goals scored. It turns out the Dutch ranked in the top third for fouls/match (although that average was helped out by the 28 fouls in the final), and clearly outperformed all other teams in the metrics vs. their fouls per match. Soccer Quantified found distinct negative correlations for each metric with regards to the number of fouls committed. This implies, clearly, that fouling is no way to win an average match. Deploying the strategy, at the right time, can win a single match. That's the essence of my post above, and I stand by it given the several missed opportunities by the Dutch that would have sewn up their first World Cup in regular time.

Friday, July 9, 2010

World Cup Finals Prediction

What I am hoping to see, but not what I expect to see

I could give you a whole bunch of reasons why the Dutch will win on Sunday. Lord knows I want to - it's not only my personal interest, but my professional one as well.

My upcoming statistical analysis hinges on it (the "he" in the linked tweet being Paul the Octopus who predicted a Spanish win).

Behind US and English soccer, the Dutch are my third love.

Then I look at Figures 1 and 2.

Figure 1: Match-by-Match and 3-Match running average Footballer-Rating score by team - dashed line is three match running average (click to enlarge)

Figure 2: Match-by-Match and 3-Match running average Footballer-Rating score differential by team - dashed line is three match running average (click to enlarge)

And Figures 1 & 2 make me face reality: if Spain and The Netherlands play anywhere near to form, the Spaniards will win the World Cup. With over a 1.2 advantage in the 3 match running average score in the Footballer-Rating system, Spain is a 3:1 favorite to defeat the Netherlands. Even more telling is that while the competition has grown tougher and the final four teams have had their Footballer-Rating scores drop accordingly, Spain is the only team to have both their score and score differential be greater than zero in the last match. They've been the only team to really maintain form, albeit a form that earns them 1-0 wins.

Sure, one could claim that Spain benefits in the Footballer-Rating system by increasing their pass percentages by making a far greater number of inconsequential passes. Then again, that's how they open you up to scoring - pass until they see an opening.

The bottom line is that Spain, statistically, is the best team. They play good possession ball, and they wait for you to make a mistake. They took a German team who was rolling, scared them so much that they changed their game plan, and then they punished them for that.

I am happy that this is the final. These two teams are the ones that steamrolled the competition in the run up to the World Cup. If Holland wins, they will be the first team since the 1970 Brazil team to run the table both in the tournament and pre-tournament. Save for their blemish at last year's Confederation Cup tournament against the US, Spain has been just as good.

Alas, I must follow the numbers. Spain will likely win their first World Cup, and deservedly so. Or you could say the stupid octopus made you pick Spain. Either way, Spain is the favorite today.

It's a shame that both teams can't win their first World Cup. I, however, will be the first person to cheer a Dutch upset if it does happen.

Happy World Cup viewing. It's been a heck of ride. Here's hoping the finish is just as good!

PS - If you're looking for a prediction for the 3rd place match, I don't really have one. The Footballer-Rating scores of the teams are a wash. Miroslav Klose may miss the match. Germany's pretty banged up, but gets Thomas Muller back from his one game suspension. Uruguay's Diego Forlan has been one of the more dangerous men in this tournament, scoring from anywhere on the pitch. I would say go with Zonal-Marking's prediction, but they don't have anything up on their site yet. By a flip of a coin, I say it's going to be Germany. And Paul says so too.

Wednesday, July 7, 2010

MLS Standings and Golden Boot Update: July 7, 2010

Picking up right where they left off - Edson Buddle and the LA Galaxy

With my trip to Europe in late-May and World Cup kicking off soon thereafter, I have neglected to cover my domestic league for the last month and a half. As the World Cup winds down and MLS starts back up after its two week World Cup break, it's now time to re-focus on domestic league action.

Projected League Finish

It's been nearly six weeks since I last updated my charts for projected MLS finish (reminder: see this post for my statistical methodology and this post for my color coding methodology). Figure 1 shows the updated predicted finish based upon team performance to date.

Figure 1: Predicted MLS finish based upon team play to date (click to enlarge)

Regular readers will note that I have added a new column at the far right. This column represents the Sports Club Stats chances for making the MLS playoffs. Here's a description of how they calculate those percentages.
Sports Club Stats calculates each team’s odds of making the playoffs, how each upcoming game will impact those odds, and how well they have to finish out to have a shot. It knows the season schedule and scores for past games. Each night it grabs any new scores from the internet and simulates the rest of the season by randomly picking scores for each remaining game. The weighted method takes the opponents record and home field advantage into account when randomly picking scores, so the better team is more likely to win. The 50/50 method gives each opponent an equal chance of winning each game. Both methods let an appropriate percent of games end in a tie or go into overtime in leagues where that matters. When it’s finished "playing" all the remaining games it applies the league’s tie breaking rules to see where everyone finished. It repeats this random playing out of the season million of times (try it yourself), keeping track of how many "seasons" each team finishes where. Finally it updates this page with the new results for you to read with your morning coffee.
I use the weighted method as I feel it is more accurate, especially this deep into the season when we have gotten a good feel for how each team will perform. The website also has Pythag methods as well as forecasts as to which of the upcoming games have the biggest impact on teams' chances of making the playoffs.

Using loose statistical theory of a p-value of 0.05 or less signifying a statistically significant relationship, I have used the following color coding scheme for the Sports Club Stats data related to playoff chances.
  • 95% or greater = green
  • 50% (i.e. flip of a coin) to 90% = yellow
  • Less than 50% = red
As one can see, my rankings align very well with those from Sports Club Stats until we get to the bottom quarter of the league where my model does not take into account the strength of the teams faced in future matches.

What the chart tells us is that we only have ten teams competing for playoff spots at this point in the season. Even then, the gap between 7th and 8th versus 9th and 10th is pretty big. The rapidly fading Houston Dynamo must turn things around in a week or two or any chance of the playoffs will be dashed. While the gap between the Chicago Fire and San Jose Earthquakes on projected season points is significant, the Earthquakes are going in the wrong direction.

Alas, my Seattle Sounders are playing for pride, CONCACAF Champions League, and US Open Cup wins at this point. They are all but eliminated from the post season hunt, even before our second DP, Blaise Nkufo, shows up for post-World Cup duty. We'll see if the notoriously fairweather Seattle sports fans stick around when their team is not making the playoffs in their second season.

Major movers

Moving Up: FC Dallas (+3 spots), New York Red Bulls (+3), four teams who moved up 1 spot. The most important of the four was the Chicago Fire who moved into 9th place in the table and have an outside shot at the playoffs.

Dropping Down: New England Revolution (-4 spots), Houston Dynamo (-4), and the San Jose Earthquakes (-3). It's almost sad to watch one of the storied franchises in the league, the New England Revolution, fail so miserably this year. They and DC United are on pace to finish behind the expansion Philadelphia Union.

LA Galaxy are still on record pace

Even with Buddle and Donovan absent for a month of World Cup duty, the Galaxy continued to roll towards shattering the season point record of 64 points set by the Houston Dynamo in 2005. They did encounter their first loss of the season, just before the World Cup break, to none other than Real Salt Lake. I am not under any delusions that Real will catch the Galaxy in point total before the end of the season, but they are clearly the second best team in the West. Not only are they running away with the top two seeds in the West, but both teams are on pace to shatter the MLS season goal differential record of 22 goals set by DC in 2007 and Houston in 2005. If they keep form, they will play out of the West in this year's playoffs. That would set up a heck of a Western Conference finals assuming that neither gets tripped up in their first round match up. Given last year's MLS Cup upset, highly contested matches this regular season, and a possible Western Conference finals match up, we may just be witnessing the beginning of good rivalry.

Golden Boot Competition

Figure 2 shows the latest data for the 2010 Golden Boot competition, and where each player stands versus the historical distribution of Golden Boot finishers.

Figure 2: 2010 Golden Boot standings versus historical distribution

Edson Buddle's goal against Seattle on Sunday kept him on pace to finish better than 98% of the Golden Boot finalists in the history of MLS. It will be a tall task for him keep up the pace, so here are the critical games player per goal values for other key percentiles:
  • 5th percentile = 1.165
  • 10th percentile = 1.304
The rest of the pack has started to regress towards more reasonable percentiles after a hot start to the year.

This Week's Matches with the Biggest Impact on Playoff Chances

Here are this week's three matches with the biggest impact on the MLS playoff race. All changes in chances of making the playoffs listed in a Win/Draw/Loss format.
  • San Jose (+12.7/-0.2/-8.7) vs. Philadelphia (5.6/-2.4/-5.7)
  • Chicago (+11.8/-2.4/-9.4) vs. Salt Lake (0.2/0.1/-0.3)
  • Houston (+10.8/-3.4/-10.0) vs. Columbus (0.3/0.1/-0.3)
Happy MLS viewing to everyone, and enjoy Sunday's World Cup final between the Netherlands and Spain!

Tuesday, July 6, 2010

Alternative Ways for Picking World Cup Winners

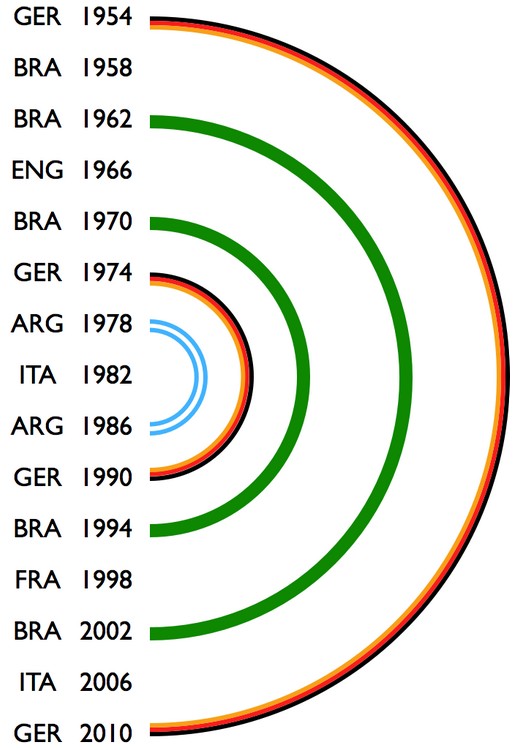
Symmetry around the 1982 World Cup gets it right 5 out of 7 times (HT: Adam).


Conversely, a German octopus has correctly predicted the winner of every German match so far. Put your money on Spain in the semifinal (HT: Grant Wahl).

File this all under "correlation does not imply causation". I prefer a more systematic, numbers-based analysis, but far be it from me to tell you how to pick your winners. Happy World Cup semifinal viewing.

Monday, July 5, 2010

Thoughts and Predictions on the Semifinals

What started with 32 teams nearly four weeks ago has now come down to four teams and four matches over the next six days. I'd like to provide some commentary on the remaining teams, their performance to date, and some predictions for the semifinal round.

Demographics

While I am not using the Soccernomics model to predict outcomes in any of these final knockout rounds, I do find the demographics of each team to be fascinating. Here are the three constituents to the Soccernomics model for each of the four remaining teams (in descending order for each attribute).

  1. Germany: 81,757,600
  2. Spain: 46,030,109
  3. The Netherlands: 16,616,850
  4. Uruguay: 3,361,000
In this category we see the Western European nations dominating with their size and population density. It turns out that Uruguay was the second smallest nation to participate in this year's tournament - only tiny Slovenia has fewer people to draw upon for their national team.

  1. The Netherlands: $48,223
  2. Germany: $40,875
  3. Spain: $31,946
  4. Uruguay: $9,426
Again, the Western Europeans dominate. The Uruguayans come in dead last in both population and GDP per capita, meaning the talent pool they pull from and resources they can dedicate to such a talent pool will be smaller than the other three nations.

  1. Germany: 709 matches
  2. Uruguay: 688 matches
  3. The Netherlands: 587 matches
  4. Spain: 461 matches
Here's where Uruguay shines. Only four teams - England, Argentina, Brazil, and Germany - have played more international games than Uruguay. Ironically, all five teams are part of the elite group of seven to have won a World Cup (Italy and France being the other two), and four out of those five made it at least to the quarterfinals in this year's tournament (sorry, English fans). Argentina, Brazil, and Uruguay have combined to win half of the World Cups contested to date. Of Uruguay's total international experience, they have played 181 matches against Argentina and 66 against Brazil (only their experience against Paraguay comes close with 63 matches). These matches mean that 36% of Uruguay's international experience comes against perennial World Cup championship contenders. While some may be surprised that CONMEBOL's representative in this year's final rounds is not Brazil or Argentina, they shouldn't be so surprised. Given the right manager and team, Paraguay should do as well as they have due to consistently challenge themselves to play against nations that are much larger than them and who continually challenge for soccer's top prize.

Not that I am counting, but some may be interested in how this adds up for a Soccernomics line. Here you go:
  • Netherlands (+0.3) over Uruguay
  • Germany (+0.4) over Spain
Regular readers will recall from my previous posts that such small spreads in predicted goal differential mean the model can't accurately predict the outcome of the match. Instead, let's take actual tournament data to understand how each team has performed so far and is trending as the knockout rounds go on.

Play-to-date

As in previous posts, I turn to the Footballer-Rating system for objectively evaluating team's performances in matches. It appears that their website is about a match behind as they have only posted results through the round of 16 (curious US fans should note that the differential between the US and Ghana ratings were 0.4 in favor of the Ghanaians, although both teams recorded negative ratings). Figures 1 and 2 below show the semifinalists' ratings and rating differential by match, with the dashed lines representing the three match running average trendline for each team.

Figure 1: Semifinalist Footballer-Rating score by match with 3 match running average dashed trendline

Figure 2: Semifinalist Footballer-Rating score differential by match with 3 match running dashed average trendline

The figures provide a useful comparison to the results realized so far in the tournament by each team.

Spain is killing the opposition in rating differential and absolute ratings, but this has translated to three narrow onw goal wins and two losses. This is likely due to the fact that Spain has passed the most, had the highest touch differential, been the most accurate passer in these finals, and the Footballer-Rating system rewards passing as well as scoring goals. It's an aberration in an otherwise mediocre performance so far for the second best team in the world according to the FIFA rankings.

Uruguay, on the other hand, has performed erratically and thus has shown relatively small ratings differential versus the competition. It shows in the basic statistics as well - Uruguay ranks at or near the bottom versus the other three semifinalists in every major category. The Footballer-Ratings scores indicate the up-and-down nature of the tournament so far for Uruguay and its fans. It seems that the Uruguayans have been able to make goals (or stop them in the case of the quarterfinal match against Ghana) when they really counted.

Save for their final group play match against Cameroon, the Dutch have completely outclassed their opponents by winning their matches with a Footballer-Rating differential of 0.7 or greater. Their absolute ratings are a bit lower, suffering from tough second and third matches in the Group Play stage. They began to turn things around with a dominant Round of 16 match, nearly equalling their opening match drubbing of Denmark. The Dutch are the only team left to have won all of their matches so far, consistently rank in the middle two spots of the four teams left when it comes to key statistics, but have the highest goals-against average of the four remaining teams.

The German ratings are a bit odd given their performance to date. Something odd happened in the Round of 16 match against England, as Germany dominated the match yet received a -0.9 rating differential. Conversely, their 4-0 opening match win against Australia earned them a +1.5 rating differential. Regardless of the ratings, the German attack has been relentless and has yielded 13 goals with three 4-goal dominating performances. The Germans rank at the top of the shooting categories, and in the middle of the passing ones.

Predictions

Last round I only went 1 for 4 as I picked too many favorites and the wrong upset. I will try not to make that mistake this time.

Figure 3 shows the Footballer rating moving average for the last three matches as scored by the Amaral Lab.

Figure 3: Three match moving average of Footballer-Rating scores

The Spain/Germany semifinal will be interesting to watch. Both squads have been impacted by similar passing/attacking styles originating in The Netherlands - it should make for an exciting match. Outstanding, experienced play is what it will take to beat the young and fast Germans. I think it is too much to ask of the Spaniards to flip the switch at this point in the tournament and go from mediocre play to outstanding play. I see Germany's offense overwhelming Spain for an upset according to Footballer-Rating.

In The Netherlands/Uruguay match I am going to take the favorite. I think the Dutch are playing too well, too consistently to not make it through to the final. Along with the Germans, they seem to have been the best TEAMS of the tournament - each player knowing their role and supporting the team accordingly. While I know my Dutch friends approach each match with apprehension waiting for the classic Dutch breakdown, this team has seemed very focused on the matter at hand and resilient when presented with a challenge (i.e. being down 1-0 to Brazil). I think they're simply too good, and they will eliminate an Uruguayan team that has fed off luck and bucking the statistics in this tournament.

If my predictions turn out correct, it'll make for a repeat of the 1974 World Cup final match. If that is the case, it would be an exciting match to watch. It would be a shame to have to see such a gifted German team lose, but I think much of the world would be pulling for the scrappy Dutch to finally deliver the world championship they have come close to winning several times before.

Friday, July 2, 2010

Everyone's an Expert

A regular reader alerted me to this fine piece highlighting a bogus analysis of what the keys are to winning the World Cup. The author dissects this post by Henry Fetter. In it, Fetter argues:
What does it take to win the World Cup? Past results suggest that going through a period of dictatorial government is almost a sine qua non for a nation to be a champion.

Indeed, soccer prowess proved a national morale builder for the dictatorships of the last century. This was particularly true of Italy under Mussolini who believed -- wrongly as it turned out -- that victory on the playing field would instill the martial virtues that would carry the day on the battlefield.
Brian Phillips then proceeds to destroy this line of thinking, making the "correlation does not equal causation" argument and then proceeding with this statistical observation.
Six of the seven past World Cup winners were governed by dictators in the last 80 years, England being the exception. That means around 86% of World Cup winners have had dictators during the World Cup’s eight-decade run. Fine. But that number is only interesting if it’s significantly higher than the percentage of all competing countries to have had dictators during the same period; otherwise it’s just an artifact of the historical reality that most countries have had dictators in the last 80 years. By my count, in the current World Cup, 25 of the 32 countries have undergone periods of dictatorship since 1930. That’s 78%, and that number treats South Africa, despite apartheid and everything else, as a consistent democracy.
I can assure you that there is no statistically significant difference in the percentage of World Cup winners who happen to come from dictatorships versus those who make up the overall World Cup finals team population. This is shear statistical idiocy on the part of Henry Fetter, who seems content to represent the "lies" and "damn lies" in that classic quote about statistics.

I've touched on this theme before. I began this blog with the following commitment because it is what every good statistician does.
I plan on approaching statistics as a tool to answer questions that I have already asked myself. I will not search for random patterns, but instead pose hypotheses based upon reasonably expected potential behavior and seek to prove or disprove those hypotheses via statistical analysis.
I've followed up with posts where I virtually agree with Brian Phillips' contention that these models are all backwards looking and must be used cautiously
Thus, we are limited to using historical data and the assumption that future behavior will follow a similar pattern. We use averages and distributions to talk about the most likely outcome of an event. If the last few years of economic turmoil taught us anything, it's that putting too much faith in the statistics and models such that the whole market buys into them produces disastrous results when the whole thing comes tumbling down quickly.
And I've argued that all of these models we make can't account for the human factor.
The challenge comes in building a blog around soccer statistics when my stated goal is to not be in search of patterns that don't actually exist. To me, this blog is a journey in understanding the many facets of the world's most popular sport. Statistics will greatly aid in that journey - to make sense of some larger truths in the sport. However, statistics often only describe the most likely outcome of an average event and not the actual outcome of a specific one, which is why we play each and every match to determine the actual outcome. In the same manner, I see statistics only being part of my journey through the world of soccer. Statistics related to the latest happenings in the soccer world will make up the bulk of my posts, but I also don't want to lose touch with the human element of the game. Soccer shapes our human experience, and to a greater degree our human experience shapes the game of soccer. I want to understand the humanity that produces the numbers I study.
I read The Atlantic each month because I find it to be a great crosstopic source of information with intelligent, articulate writers. The magazine is, however, in the business of making money and they have greatly expanded into the world of blogging and Twitter to keep up with the times. In doing that, they must often publish sensational, if wrong, material. Henry Fetter's piece on the Atlantic.com is the equivalent of tabloid journalism for people loosely interested in soccer statistics. He has enough of a hook (dictatorships win championships so the Dutch can't possibly win) to get people interested and make them think they now have some nugget of wisdom that few have. Because Fetter nor his readers have a basic understanding of statistics, they won't pick up on the statistical error that Brian Phillips points out.

The sad fact is that there is great commentary on the role of dictatorships in soccer. The challenge is that it takes a ton of original research to document - it can't be cranked out in a few paragraphs in a blog post using bogus statistics. If you're interested in such good research, I'd highly recommend Chapter 7 of Soccernomics which gives a good treatment of authoritarianism, the roll of factory towns, and possible future trends of democratic national capital teams winning the UEFA Champions League sometime soon. Another great discussion on the roll of a dictator in soccer is Chapter 8 of How Soccer Explains the World which gives a good bit of background on Barca as a symbol of resistance to Franco's rule.

Philips's gripe about every person with a calculator becoming a "soccer oracle" at this World Cup is valid. He does, however, seem to get lost in his hatred for garbage like the stuff spewed from Fetter's Atlantic article. I am sure that Szymanski and Kuper would be the first ones to tell you that some of their models are long-term averages, just as I said in my last post, and should be used very sparingly to predict the specific outcome of a match. Just because their model is being misused doesn't mean they don't have a valid point. The gripe shouldn't be with the authors, who are properly trained in the techniques they deploy. The gripe should instead rest on the untrained who speak of that which they know nothing about simply because they read a book. Conversely, researchers who develop match specific metrics should be lauded for using their skills to help us better understand individual contributions to teams' success. None of the authors of these papers or books claim that their methods have allowed them to discover the secret to assembling a great soccer team or develop the best strategy for defeating a specific opponent. Only Henry Fetter did that. Most researchers just help provide data-driven insight to balance our emotional love of the game and team.

I try to keep my blog positive, and not indulge in attacking others. I've toyed with the idea of having a re-occurring "BS stat of the day" to highlight the garbage that passes for statistics in newspapers, blogs, and magazines. I've resisted that temptation so far, reminding myself that my goal is not to be an elitist but to hopefully raise the level of soccer statistics discourse. Nonetheless, there's plenty of Henry Fetters out there producing statistically incorrect analysis and making money doing so. My hope is to periodically expose such material without resorting to the cheap shot of a regularly negative blog post.

Short- and Long-Term Statistics: World Cup Quarterfinal Predictions

Soccer Dad at Soccer Quantified provides a nice cautionary tale about the over reliance on statistics in trying to predict the outcome of individual matches like those in the World Cup. He provides a nice link to my "Statistics Are Just Numbers" post, and after reading his post I feel compelled to comment on the subtle difference in some of the statistics I have used during this World Cup.

There are two types of statistics that I have used to predict performance in this tournament - longer term demographic data within the Soccernomics model and shorter term team performance data within the Footballer-Rating.com model. They both serve good purposes at
different stages of the tournament. Let me explain.

Socceromics Model In Group Play

The Soccernomics regression uses demographic data and match results over decades to predict the most likely outcome of a match between two teams. That is to say that it will tend to make better predictions in larger sample sizes where individual matches have less
impact (i.e. not win-or-go-home). Team adrenalin and short term boost have less of an impact in group play matches than knock out round matches, both in the many games that must be played and in the fact that each team knows that they must perform over those many games. This makes the Soccernomics model better suited for group play, although many statisticians might argue that three group play matches per team and 48 total matches might still be a smaller-than-ideal sample size for such a model. I will let my last post be the judge of that.

There is an additional benefit of using the Soccernomics model in the group play rounds. It will not only provide a reasonable prediction over time, but it also plugs a gaping hole - no player rating data exists for such matches. As much as we'd like to have a more direct method to compare the teams in their group play matches, there is very little short term data available to make such comparisons. The high pressure qualifying matches that might be the closest environment to that faced by World Cup teams are completed six months prior to the start of the final tournament. Team composition, chemistry, and momentum have changed greatly in those six months. The friendlies that most teams play as warm ups to the tournament are just that - they are good warm up matches, but they are not anywhere as competitive as a World Cup match. Thus, we must turn to longer term demographic data at the outset of the tournament to get a reasonable idea of which teams are going to make it out of group play and which teams aren't.

Footballer-Rating Model in Knockout Rounds

The knockout rounds are a different matter. After three matches of group play action, we can quantify how well a team did against World Cup caliber teams in a World Cup setting. We can begin to understand which teams are lucky to be in the knockout rounds based upon their play to date, and which ones got into them by dominating their competition. At this point, a player or team-based metric that evaluates actual performance should provide a better judge of future near term performance than a long-term demographics based model. Enter Footballer-Rating's player metric model, which got seven out of the eight Round of 16 matches correct compared to the Soccernomics model that got five out of the eight matches correct. Statistically, the chances that the Soccernomics model is more accurately predicting the outcome of the knockout matches versus simply flipping a coin is only 16%, while the Footballer-Rating method's chances are 76%. Why is that?

Recall from my last post where I showed that the ability of the Soccernomics model to accurately predict a "not lose" situation greatly increases once predicted goal differentials rise above 0.5. The problem is that most of the disparity in team performance based upon demographics is gone by the time the knockout rounds start. There were only two matches in the Round of 16 where Soccernomics predicted goal differentials larger than 0.5, and in both cases the predicted winner actually lost the match. In one case the Footballer-Rating prediction greatly favored the opposite team, and in the other case it predicted a virtual draw (which did occur during regulation and extra time). Combine these low goal differentials with the fact that the knockout rounds cannot produce a tie, and we see that the Soccernomics model is not a good fit for knockout round predictions. The Footballer-Rating model, which looks at recent play at the same tournament, naturally provides better predictions.

Quarterfinal Predictions

Based upon the accuracy of the two models in the two different phases of the tournament, I will be using the Footballer-Ratings model for the rest of the tournament. However, it must be said that their is one shortcoming with that model - the authors of the website that compiles the team ratings are not updating it with knockout round match data. I would have liked to have seen such updates, as team performance can change throughout the knockout rounds as the quality of opponents continues to rise. Nonetheless, Figure 1 shows the Footballer-Rating team average scores from the group play stage.

Figure 1: Footballer-Rating average team scores from group play matches

From a previous post we know that a gap of 0.7 or greater means that the favored team's chance of winning that match is 75%. With each match exceeding this threshold, we're likely looking at a semifinals round with Brazil, Ghana, Argentina, and Paraguay. Given that Ghana's predicted gap is the smallest and Uruguay's stiff defense, I would expect that the most likely upset might come from that match. I think Germany has a reasonable shot at slowing down Argentina. The Argentines are flying so high right now that they simply must regress to the mean at some point, and teams that perform so well and all of the sudden hit their first serious challenge often choke up a little bit. However, while I think the Argentina/Germany match may be close, I don't think the Germans have enough to beat Argentina.

So, here's my prediction for semifinalists: Brazil, Uruguay, Argentina, Spain. It's been a CONMEBOL dominated World Cup. Why stop now?

LinkWithin

Related Posts Plugin for WordPress, Blogger...