In the first two posts in this series, I was able to demonstrate the following:
- Utilization rate, as measured by a team’s average cost of their starting XI divided by the average cost of their squad, is declining by about 1% every three years.
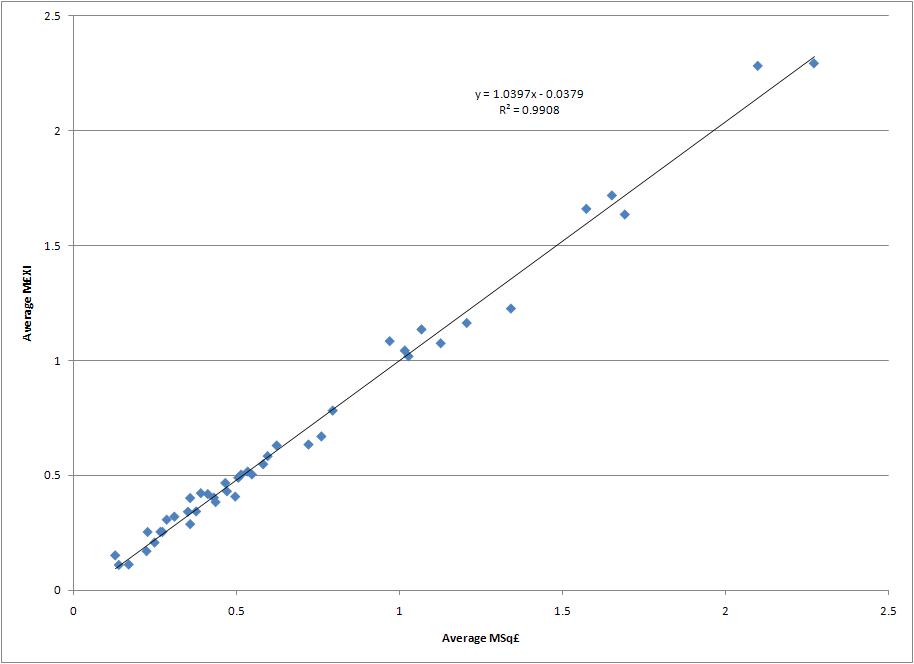
- A regression model can be used to correlate a team’s average finish within the league with their average multiple of the league average starting XI cost.
- The prediction intervals (PI) from such a model can be used to predict the odds of finishing in a certain table position based upon a team’s costs (both squad and starting XI).
Under and Over Performance of Clubs
Recall the graph below from my most recent post on teams' M£XI.

Note that the upper and lower bounds of the 50% PI are denoted by dashed red and green lines, respectively. Teams that fall above the red line represent a team that has, on average, finished in the lower 25% in terms of table position of teams that would have had similar expenditures. This represents under performance. On the other end, teams that finish below the green line have, on average, finished in the upper 25% in terms of table position of teams that would have had similar expenditures. This represents over performance. The teams that fall on or between these lines represent the expected 50% of teams that scatter around but close to the regression line. They are considered pushes.
Just like the similar MSq£ analysis, it’s not just good enough to have an above average finish. Consistency is what matters – in this case, consistency is measured via the team’s standard deviation of their residual to the regression model.
The table below represents just such a ranking (click on the table to enlarge). It is sorted first in order of performance against the model (over performance, push, under performance), then by standard deviation of residuals in decreasing order within each group, and then by the average residual. The table also shows the change in each team’s position (a negative score indicates improvement, while a positive score indicates degradation) from a similar table that looked at performance versus the MSq£ model. Just like the similar MSq£ analysis, only the 33 teams that have played three or more seasons in the Premier League have been included in this analysis.

It turns out the average absolute movement in the table is 1.76 positions, and the median value is 1. Nearly 85% of the teams moved two or fewer positions between the MSq£ and the M£XI tables. This should come as no surprise given the correlation between the MSq£ and M£XI metrics that was noted in an earlier post. Of the three teams who moved four or more positions, here is an explanation why each of them moved.
Liverpool’s movement into the top spot is due to their eking out a position in the over performance group that they just missed when looking at their performance vs. the MSq£ model. In the MSq£ model, Liverpool actually finished in the top spot of teams in the push category which consigned them to 8th position in that table. They have a nearly identical M£XI (1.64) as MSq£ (1.69), but because of the difference in slope terms in the two models (noted here) we know that multiples of the league average don’t go as far in the starting XI as they do in the squad. Thus, Liverpool ends up moving from a push to an outperform when looking at the cost of talent that made it on to the pitch and their second lowest standard deviation of residuals to the M£XI model (only the top under performer, West Bromwich Albion, “outperforms” them) carries them to the top spot in the rankings. Clearly no one gets more consistent over performance versus the financial expectations on the pitch than Liverpool. Supporters’ expectations are another matter…
The overall biggest improvement over their MSq£ performance is West Ham United. West Ham’s utilization rate has been extremely low – an average of 45.7% to rank them in the bottom sixth of all 43 teams that had competed in the Premier League through the 2009-2010 season. The teams that have ranked lower than them – Bradford, Derby, Hull, Reading, Southampton, Stoke, and Watford – spent an average of four seasons in the league. The fact that West Ham has spent 14 seasons in the league – missing only the inaugural campaign and two seasons of relegation from 2003 to 2005 – is a testament to their ability to squeeze a good bit out of a meager transfer budget that has a lower than normal utilization rate. West Ham has averaged a 5% lower utilization rate than the league average each season, with only three of their fourteen seasons seeing above league average utilization. See the graph below for the details of West Ham’s utilization rate each season versus the league average. Such a low utilization rate translates into an M£XI that is 12.5% lower than their MSq£, thus leading West Ham to move out of the push category and into the over performance category with a nearly identical standard deviation in residuals to the two models.

With the addition of West Ham and Liverpool to the over perform category, and none of the seven teams that fell into the same category in the MSq£ category falling out in the M£XI analysis, the overall number of teams over performing on an M£XI basis has increased to nine.
At the other end of the table we find the team with the next largest movement – Nottingham Forest. During their five seasons in the league between the 1992/93 and 1998/99 seasons they averaged a 15th place finish when their M£XI costs would indicate an expectation of averaging a 14th place finish. This places them within the 50% prediction interval for their starting XI costs, which moves them from the bottom of the under performance category to the bottom of the push category. Like West Ham, this is due to the fact that their average difference to the league average utilization rate was -5.9%. This led to a 12% lower M£XI compared to their MSq£. Ironically, the club had its second best performance in terms of utilization their last year in the league, but it wasn’t enough to save the club from relegation.
Under and Over Performance of Managers
If movement amongst the clubs in the M£XI is minimal, what about the managers? How much do they move when one takes into account the talent they can get on the pitch and not just the players they can buy and sell for their squad, and which managers over and under perform the most when compared to the financial expectations of the players on the pitch? The table below summarizes just such managerial performance versus the M£XI for the 40 managers who have presided over at least three full seasons of Premier League play (click on table to enlarge). As in the similar table for team performance versus the M£XI model, the column on the far right shows a manager’s change in ranking from the MSq£ table, with a positive change indicating a backwards slide while a negative rating means the manager ranks higher in this table than the MSq£ table.

Unlike the club table, there is a fair bit more movement on the managerial side. The average absolute movement in the managerial table is 3.2 positions, while the median movement is two positions. Nearly 77% of the managers experienced a movement of three positions or less versus their MSq£ rankings. Let's dig into the details of a few of the managers that sit atop the table, and a few others that experienced some of the biggest movement.
Similar to the MSq£ rankings, Chris Coleman sits atop the M£XI table benefiting from an M£XI that is 4% lower than his MSq£. However, John Gregory has fallen seven positions to the ninth spot in the table. A comparison of MSq£ and M£XI explains why - Gregory spent an average of 1.11 times the league average on squad transfer cost, but his starting XI average cost was 1.24. This was due to an above average utilization cost the three years he was at Aston Villa, while his third year at the club saw a phenomenal 70.3% utilization rate (M£XI = 1.57, CTTP = £75.5M). In fact, no one put a greater proportion of their talent on the pitch that year. What’s more telling is the fact that six teams (Manchester United, Arsenal, Liverpool, Chelsea, Aston Villa, and Newcastle United) fielded average starting XI’s that we more costly that season. Aston Villa’s eighth place finish was behind all but one of those clubs (Newcastle finished eleventh), and finished behind Leeds United, Ipswich Town, and Sunderland sides that fielded average starting XI’s that cost less to various degrees - £73.9M, £21.9M, and £31.9M respectively. While Gregory still outperformed the model on average, it could be said that his last full season at Villa was one where he had the most tools at his disposal on the pitch. It should be noted that the model only predicts a marginally better seventh place finish for the squad in that season, indicating that perhaps Aston Villa management’s expectations were still a bit too high given the financial resources they were willing to commit. No matter the reason, Gregory’s steadily increasing utilization rates over his three year term – 48.4%, 52%, 70.3% - contributes to an increasing M£XI and increased variability versus the model that shows up in Gregory’s standard deviation of residuals. This is ultimately what lowers his ranking by seven positions – putting more talent cost-wise on the pitch each passing season and seeing a relatively consistent sixth to eight place finish.
Rafael Benitez and Martin O’Neill leapfrog Evans and Houllier in the M£XI rankings for one main reason – extremely consistent M£XI, utilization, and table position statistics.
In fact, if Benitez hadn’t had such a poor last season at Liverpool he would have outranked Chris Coleman in terms of standard deviation of the residual to the M£XI model. Then again, if he hadn't had such a poor 2009/10 he might also still be managing there this year. Recall from the first post in this series that Liverpool has hovered around 50% utilization from the 2005/06 to 2009/10 seasons – indeed, Benitez’s lowest utilization was his first year (2004/05) at 41.8%. He consistently beat his squad’s M£XI expectations by at least two table positions, and twice nearly beat it by four table positions. Only in his final year did he fail to meet M£XI expectations, finishing 0.6 positions off the expected pace. Say what you like about Rafa, but he made the most of the talent he had on the pitch.
Along with being one of the most consistent over performers, Martin O’Neill also has one of the highest average over performances versus the M£XI model – only Sam Allardyce (-5.9) and Gerry Francis (-4.6) outperformed him (but with much less consistency). O'Neill's first stint in the Premier League was with Leicester City, where he averaged six places better than his meager transfer budget would have predicted (average MSq£ = 0.44, average M£XI = 0.46) and guided them to three League Cup finals (winning two of them) over a four year period. After departing for Celtic for several years, O'Neill returned to the Premier League via Aston Villa before the 2006/07 season. Over his four seasons at Villa, he guided them from an initial 11th place finish to a sixth place finish each of the following three years. He averaged nearly three places better than his M£XI suggested. While his cup success at Leicester didn't translate to similar success at Aston Villa, O'Neill did put Villa back in the top third of the table and was consistently threating for European play. Ironically, it is widely understood that O'Neill left Aston Villa after the 2009/10 season because of his disagreement with Villa's ownership over his desire to spend more money to improve their chances of finishing higher in the table. Perhaps Martin O'Neill and John Gregory should have a discussion about how such Villa transfer budget limitations, and the unrealistic expectations that are attached to them, can wreck an over performing team.
Further down the list we find the two managers who fell the most from their MSq£ rankings - Peter Reid (13 positions from low overperform to low push) and Claudio Ranieri (14 positions from high push to under perform).
Reid spent one year at Manchester City in the league's inaugural year, and then spent over four years at Sunderland - one full year in 1996/97 and three straight from 1999/00 to 2001/02. Sunderland's MSq£ and M£XI numbers were relatively consistent during Reid's tenure, but their finishes were not as the first and last years saw 18th place finishes that led to relegation while the middle two saw them finish 7th. That variability produced huge swings in his residuals, meaning that Reid's standard deviation in residuals is only surpassed by 10% of the managers in the table. Combine this with Reid's high utilization rates that boosted his M£XI by 15% versus his MSq£, and it is clear why he shifted from over performance to a push.
Ranieri's three years in the league saw him average a fourth place finish when club expenditures indicated that he should have averaged a second place finish. Even before Abramovich bought the team, Ranieri was seeing huge advantages in terms of the cost of the talent he could put on the pitch (2001/02 M£XI = 1.89, 2002/03 M£XI = 2.02). With Abramovich's purchase of the team and infusion of transfers in 2003/04 Chelsea became the fist team to break the 3.0 barrier on the M£XI metric, but were unable to win the Premiership due to Arsenal's Invincibles' run of perfection. Ranieri's three year run put his average M£XI nearly 10% higher than the average MSq£, and has happened so frequently in the table this greatly lowered Ranieri's ranking from one category (push) to the next lowest (under perform). Regardless of the metric, Roman Abramovich felt Renieri was under performing and replaced him with Jose Mourinho who brought them two Premier League Championships in three years.
Conclusions
A clear connection can be drawn between the cost of the talent a club can put on the pitch in the English Premier League and the likely table position that team can expect. The model doesn't explain every team's position, but it does explain nearly 70% of the variation in average team finish position and average transfer expenditure on the pitch. The other 30% is random noise due to factors that aren't quantified in the model. The model doesn't also explain match-to-match variation, where squad and starting XI transfer cost is likely far less deterministic.
What the model does do is set clear expectations for long-term success and failure. While a number of the concepts in this series are a bit advanced, they illustrate a key point for supporters and management: set your expectations for a manager's long-term average table position based upon how much they're allowed to spend in the transfer market.
While no hard and fast rules can be drawn, here are a few concepts one could apply based upon the MSq£ and M£XI analyses:
- If a club wants to know how much money it must spend to avoid relegation year-in and year-out, they must spend at least the league average in terms of squad transfer costs. For 2010/11, this was nearly £116M.
- Managers who can't achieve at least a 50% or better utilization are likely going to under perform. Managers lower in the table in terms of squad transfer costs need to coax a larger utilization percentage out of their playing staff to remain competitive.
- Don't judge a manager on less than three years performance, and certainly don't sack him unless it's an emergency move to avoid relegation. Managers need time and money to succeed, and at least three years are needed to build a team that reflects the priorities and tactics of the current manager and not the last one.
- Along those lines, don't expect a single, expensive transfer to move a team out of mid-table mediocrity into European qualification in one season. Soccer relies on eleven starters, several substitutes, and a number of back up players for a team to be successful. Those players require a system to play within, and the manager needs time to get players to instinctively play within the system. Soccernomics was right in one regard - transfer purchases made in one window show little correlation to success or failure in the current or next season. Building a team via transfers is a long-term investment that requires patience - on the part of supporters and management.
- Pay attention to why a manager's utilization rate may be under 50%. If it's due to poor investments that didn't work out on the pitch, clearly the only option is to move on. But if it's one year of bad luck with key injuries to costly players, the manager should be given the benefit of the doubt.
- If the goal is a Premier League championship, be prepared to spend big. Recall this table from my last post on the M£XI topic, which shows a club must be willing to spend at least 2.40 times the league average in squad and starting XI transfer cost to have even odds at winning the Premier League title. Such certainty will likely decrease in coming years, as the Big Six and a few other teams continue to flood the transfer market with pounds. This will drive the cost of a championship higher, while at the same time dilute the power of a single team being able to "buy a championship".
- Recognizing the reality of the spending required of a championship, perhaps management and supporters should set more realistic expectations and aspire for European qualification as their ultimate goal. Some are already advocating this approach for at least one of the more financially limited clubs amongst the Big Six. More clubs should adopt this approach to keep finances manageable and expectations achievable.
- Finally, if Liverpool are in the market for a new manager after Kenny Dalglish's care taker term runs out, I would think they would seriously consider Marin O'Neill for the job. Clearly the previous ownership group made a massive mistake in going with Roy Hodgson over O'Neill last summer. I don't pretend to know the thoughts of senior Fenway Sports Group managers, but I do know they're smart and use analytics to help guide their decisions. If O'Neill's tactics and transfer strategies are right for the club, I could think of few managers who would likely over achieve to a greater degree given Liverpool's storied history yet somewhat limited financial means.
I already know what my next financial posts will focus on once the current Premier League season wraps up and the mood to write about transfer markets strikes me again - a detailed dissection of Arsene Wenger's moves in the transfer market. Yes, I am a bit biased, but the data clearly shows that Wenger is the longest serving over achiever in the English Premier League. For Gooners like me, reconciling this over performance with the lack of trophies the last six seasons is the ultimate test of what I preach: setting realistic table position expectations based upon transfer expenditures. In doing such a detailed study, I hope to provide a better understanding of his successes, failures, and what types of expenditures might put him over the top yet allow Arsenal to win a much less expensive trophy. As they say in the investment industry, "can I eat my own home cooking?"
No comments:
Post a Comment