In the first post in this series on the rising cost of a squad's starting XI was quantified, the decreasing utilization rate amongst teams was explored, and the behavior of the Big Six clubs when it came to starting XI transfer costs was presented. But what about a more general model, one that uses linear regression and prediction intervals to quantify expected table position based upon a squad's starting XI cost? How could such a model be translated into predictions for the odds of finishing in various positions in the Premier League table based upon starting XI cost? Those topics are explored in this post, with special attention paid to the clubs that represent outliers.
A Regression Model for Table Position vs. Starting XI Cost
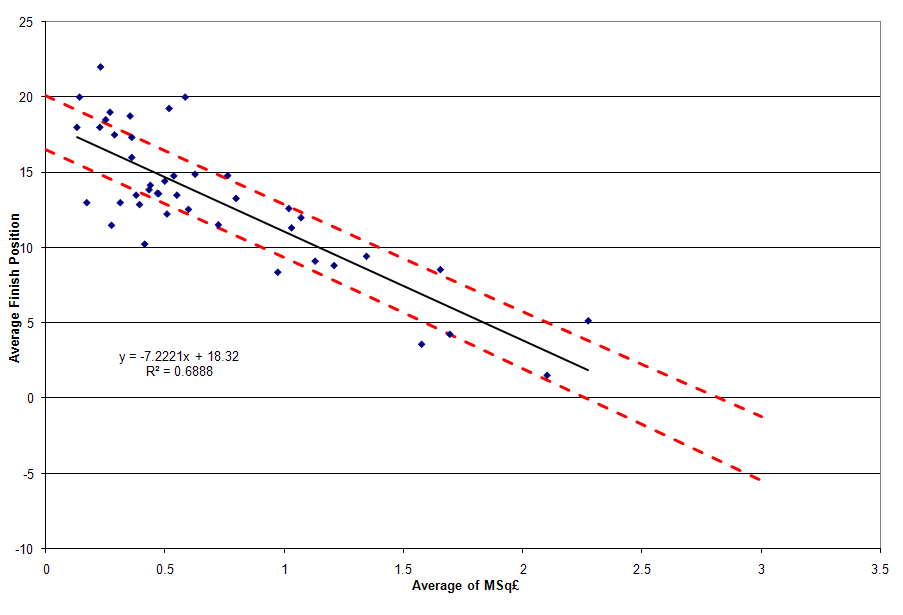
Similar to this post on squad transfer cost, a linear regression model with various prediction intervals can be constructed for average table position and average starting XI cost. Such a regression provides a good indication of how much the talent on the pitch should cost over the long-term to provide long-term success in table position.
There is a slight difference in the M£XI graph below compared to the one in the MSq£ post: the regression line, 50th percentile, and 95th percentile prediction interval lines all appear on one graph. This consolidates what was multiple graphs into a single graph where the full range of under and over performance can be viewed.
The dashed black lines - representing the bounds of the 95th percentile prediction intervals - indicate the bounds of reasonably expected individual values. Data points that fall outside of these lines indicate gross under performance (above the upper line) or outstanding over performance (below the lower line) versus the expected finish position given the average cost of the starting XI the team put on the pitch.
The dashed red line represents the upper limit of the 50th percentile prediction interval. Falling above this line indicates under performance versus the model. Conversely, the dashed green line represents the lower limit of the the 50th percentile prediction interval. Falling below this line indicates over performance versus the model.
Click on the graph to enlarge it.

It's interesting to note the similarities and differences between the graph above and a similar regression plot for MSq£ from this post.
- The constant term in each regression equation - M£XI = 18.04 while MSq£ = 18.32 - indicates teams with relatively low multiples of the league average starting XI and squad transfer costs will be at similar risk for relegation.
- The difference in the slope terms - M£XI = -6.9195 while MSq£ = -7.2221 - indicates an advantage in finishing position for increased multiples of squad expenditures of 0.30 versus their multiple of the league average starting XI cost.
- However, the reality is that paying for talent that actually makes it on to the pitch is still the best way to improve one's chances of finishing top of the table (quite intuitive, isn't it?). Even though the slope of the MSq£ regression equation indicates a 4.4% advantage in table position improvement vs. the M£XI equation when increasing multiples of the league averages are utilized, the fact remains that the average squad cost is more than double the average starting XI cost (2.12:1 to be exact). Thus, signing talent and making sure they play all 38 games in a Premier League season is nearly twice as effective at increasing one's multiple to the league average £XI compared to simply breaking the bank and trying to increase one's squad transfer cost versus the league average Sq£.
- The bounds on the 95th percentile and 50th percentile lines in both regressions are relatively close. What has changed is several individual team's proximity to those lines.
A detailed discussion of over and under performance vs. the M£XI model will come in the next post, but a few words should be spent on the data points outside of, or close to, the 95th percentile lines.
The two teams outside of the upper 95th percentile line - Swindown Town and Odham Athletic - were previously discussed in this post. The only other team close to the line is Crystal Palace, who spent three campaigns in the EPL between the 1992-93 and 1997-98 seasons and was relegated after each single season they spent in the league. Since that last season in the Premier League the club has gone through several owners and has bounced between The Championship and League One.
On the other end of the 95th percentile distribution stands three teams that have out performed all other teams when adjusting for their financial resources - Queens Park Rangers, Reading, and Stoke City - although two of the three are likely not examples other Premier League teams would ultimately like to follow.
QPR, as an inaugural member of the Premier League, finished fifth their first season in the league. Mid-table finishes the next two seasons were followed up with a 19th place finish in 1995-96 that saw them relegated to the Championship. Their average M£XI of 0.42 was simply too small to avoid such a fate. They eventually were relegated further to League One, and subsequently saw them pass into administration. A reconstituted QPR has found itself a mid-level team in the Championship in recent years.
Reading made a brief two season appearance in the Premier League from 2006 to 2008, and their average M£XI of 0.11 ranks as the second lowest in the history of the Premier League (Watford's 0.10 barely beats them). Good form in the 2006-07 season, which saw them finish eighth, was followed by a season with a disastrous second half and relegation back the Championship. The team nearly regained their spot in the Premier League the following season, but lost in the Championship's promotion playoff.
Stoke City's one and only year in the league (2009-10) saw them finish twelfth with an M£XI of 0.25. As of this writing, Stoke is on track for another 12th place finish, but is at risk for relegation with only three points separating them from the drop at 18th position in the table . Surviving for a third year would mark a milestone few teams with such a meager transfer budget on the pitch attain. Only one other club (Birmingham) has spent as little on transfers and remained in the Premier League more than two years.
Ultimately, that's what this analysis and the one related to MSq£ prove - gross under and over performance is only found at very low multiples of the league starting XI and squad transfer costs. In both cases, such under and over performing teams don't seem to last long in the Premier League as their meager transfer budgets are no match for the teams spending more than them. There are only six teams in the Premier League who can spend the money to compete for a Champions League position each year, and only twelve teams in the history of the Premier League have managed to spend the league average or better (seven of which are the teams never relegated). The interplay with the teams in the Championship looking for promotion the subsequent season can't be underestimated either. While these lower spending teams certainly outperformed expectations in the Premier League, they often occupy the middling of teams that could just as easily find their transfer expenditures (and subsequent place) in the upper half of the Championship.
The Impact of M£XI On The Odds of Various Table Positions in Premier League
If the odds seemed to be stacked against such spendthrift teams, what about those who choose to spend more? How are their odds impacted by greater expenditures, and how do they know they've spent enough to have a good chance at their goal - a spot in UEFA competitions or the Premier League title? Luckily, ever expending prediction intervals can quantify such odds. The following series of tables do just that, quantifying the squad and starting XI transfer costs and multiples required to achieve such odds per the regression model.
A reference point for average values must first be defined before translating the predicted multiples into absolute values. The average Sq£ at the beginning of the 2010-11 season was £115.7M, while the projected £XI for 2010-11 is £54.7M (based upon the average from 2009-10 and projected growth of £585.5k per year via the regression model) .
The table below shows the squad and starting XI expenditures required to realize various odds of finishing top of the table in the Premier League. The regression model is pretty accurate for the lower odds based upon the expenditures witnessed over the years. Of the thirteen teams who had an M£XI of 2.46 or more six have won the Premiership, and a similar outcome is seen for teams with an MSq£ of 2.40 or greater. The accuracy of the model starts to break down just a bit the higher one goes in the odds - history shows that four of the ten teams who have had an M£XI of 3.05 or more four winning the Premiership.

What about the required expenditures to improve a club's odds for making the Champions League given the Premier League's four spots? The table below summarizes those odds.

This is really where the model's effects of over predicting the financial resources required of clubs comes into play. Of the 25 teams who have had an M£XI of 2.03 or more, only 3 have failed to finish fourth or better. Manchester City's 2009-10 and Newcastle United's 2003-04 campaigns saw both finish fifth, while Newcastle set a new standard for under achievement with a 11th place finish with an M£XI of 2.41 in 1999-2000. Ninety-five percent of teams that finished fourth or better have had an M£XI of 1.05 or better, with Arsenal's annual over achievement versus their transfer expenditures adding to the low M£XI totals.
Conclusions
A regression model that predicts table position based upon a club's multiple of the league average starting XI transfer cost has been constructed, and its resultant prediction intervals have been used to identify gross under and over performers. Those under and over performers seem to be concentrated at the low end of the M£XI distribution. Additionally, odds of finishing in the upper 20% of the league have been identified, with various accuracies to historical data being realized.
An analysis of team and club under and overperformance versus the 50th percentile prediction interval, similar to the one conducted for MSq£, can now be conducted. That topic will be the subject of the third-and-final post in this series.


No comments:
Post a Comment